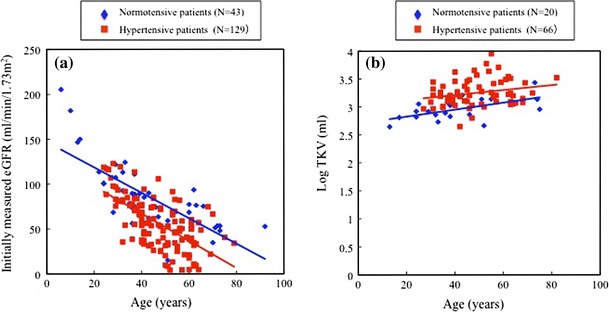
Fig. 5.

a Initially measured eGFRs are plotted against age in normotensive (blue) and hypertensive (red) patients. Regression analysis for normal blood pressure group: y = 151.08 − 1.546x (where y = eGFR and x = age, r = −0.7791, P < 0.0001, n = 70) and that for hypertensive group: y = 132.30 − 1.666x (r = −0.6587, P < 0.0001, n = 158). b The relationship between age and log-transformed TKV in normotensive (blue) and hypertensive (red) patients. Regression analysis for normal blood pressure group; y = 2.7003 + 0.006275x (where y = log TKV and x = age, r = 0.57859, P = 0.0075, n = 20) and that for hypertensive group; y = 3.0339 + 0.004452x (r = 0.23144, P = 0.0615, n = 66). In both a and b, the regression lines for normotensive and hypertensive patients were not considered to be identical, with different y-intercepts, since there was a significant difference (P < 0.01, F test) in the y-intercept of the two regression lines under the null hypothesis that the y-intercept of two lines was identical. There was no significant difference (P = 0.6061 in a or P = 0.6079 in b, F test) in the slope of the two lines under the null hypothesis that the slope of the two lines was identical
