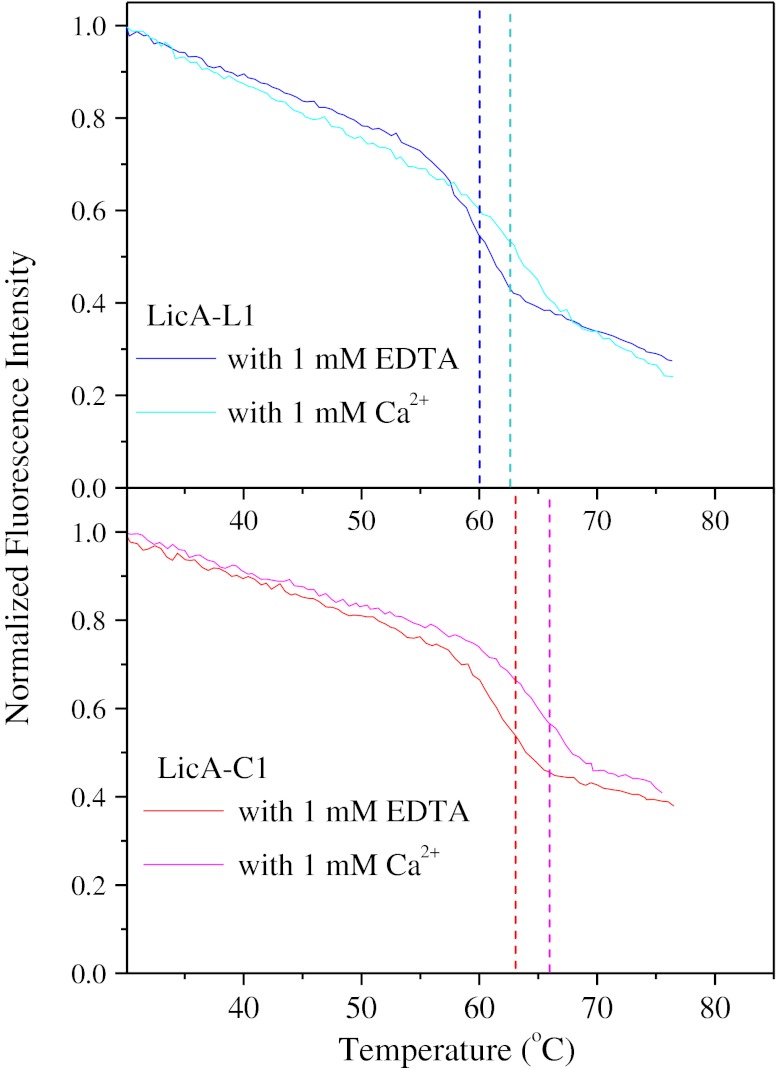
Fig. 8.
Temperature-induced unfolding measured by fluorescence spectroscopy of the linear and circular LicA with 1 mM CaCl2 or 1 mM EDTA. Fraction values were calculated by normalizing the fluorescence emission intensity data at 345 nm to the respective value at 30 °C. Excitation was at 295 nm. The transition temperature of unfolding was determined upon differentiation of the fluorescence intensity vs. temperature data and calculation of the minimum using the differentiation function of Microcal Origin™ software

