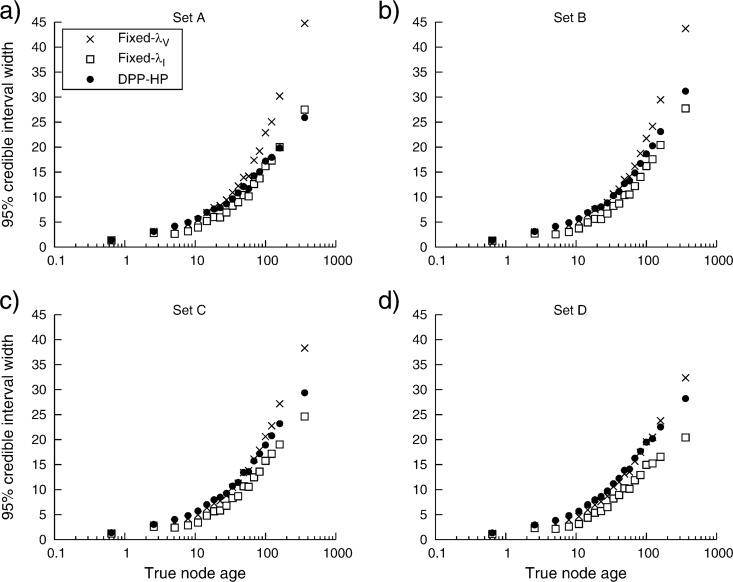
Figure 7.
The change in the size of the node age 95% CIs as node age increases. The true node ages were binned (each containing 100 node depths) and the average 95% CI width was calculated for each bin. Each plot compares the within-bin average 95% CI size with the average bin age (on the log scale). The results are shown for analyses using calibration sets A, B, C, and D (Fig. 4) when a DPP-HP (•) is applied to calibrated node times and when vague (Fixed-λV: ×) or informative (Fixed-λI: □) fixed priors are used.

