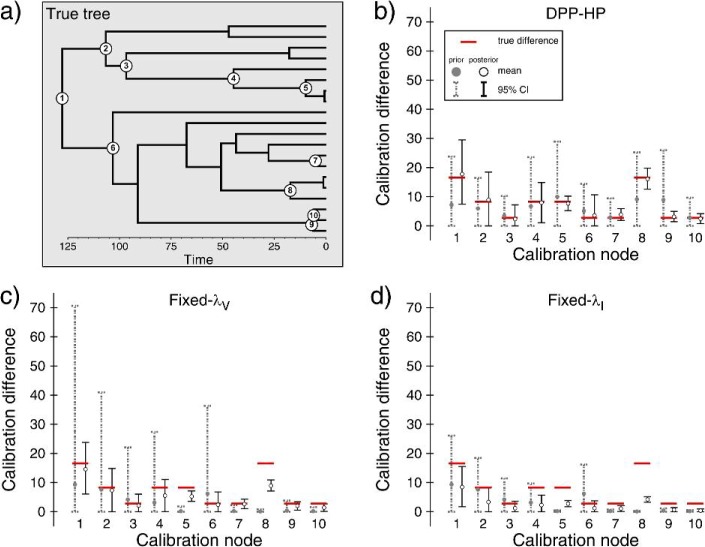
Figure 8.
An example of the results from a single simulation replicate when a calibration set with three categories of fossils (set C; Fig. 4c) was used to estimate divergence times. The true tree topology and divergence times are shown in (a), and the 10 calibrated nodes are numbered. In this figure, graphs (b), (c), and (d) show the average (white circles) and 95% CIs for estimates of the calibration difference (δ = AT − AF) between the calibrated node age and the fossil age for each of the 10 fossil constraints (black vertical lines). The gray dotted lines indicate the 95% CIs under the prior. The true age differences are shown using horizontal bars. The results are shown for analyses under the DPP-HP is used (b), the fixed vague prior on calibrated nodes (c: Fixed-λV), and the fixed informative prior (d: Fixed-λI).

