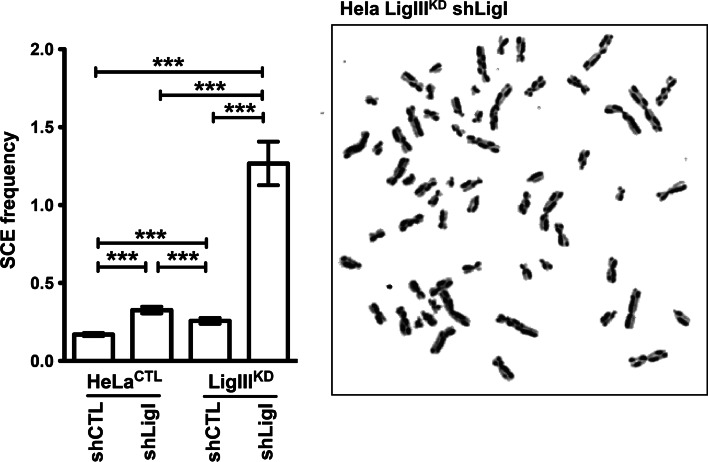
Fig. 5.
LigI and LigIII cooperate in the suppression of SCEs. A representative image of metaphase spreads prepared for SCE analysis from HeLa cells depleted in both LigI and LigIII. The histogram on the left shows the average SCE frequency per chromosome in the different cell types calculated from 37 to 50 metaphases for each cell lines ***p < 0.0001

