
Fig. 1.
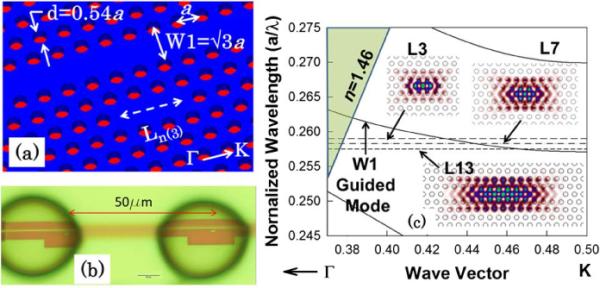
(a) Device schematic. (b) Inkjet printed biomolecules on PC devices showing spacing between printed spots (scale bar is 10 μm). (c) Dispersion diagram of W1 PCW in water. The W1 guided mode is shown together with frequencies of resonant modes for L3, L7 and L13 PC microcavities by dashed lines. Respective mode profiles are shown in insets.