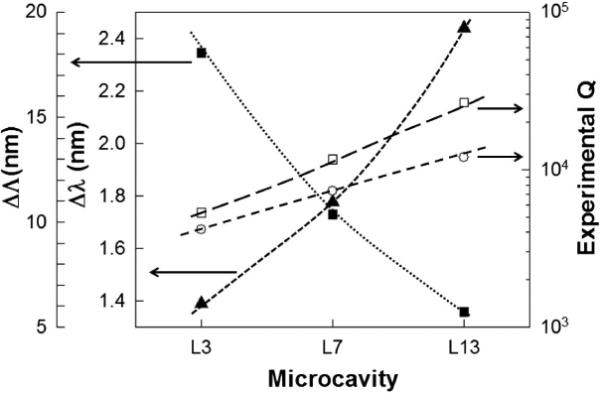
Fig. 3.

Plots showing trends in L3, L7 and L13 PC microcavities for resonant mode (a) quality factor in water (open circle) (b) quality factor in IPA (open square) (c) approximate mode offset from the transmission band edge (filled square, left offset axis) and (d) wavelength shift from water to IPA (filled triangle, left axis).
