
Fig. 4.
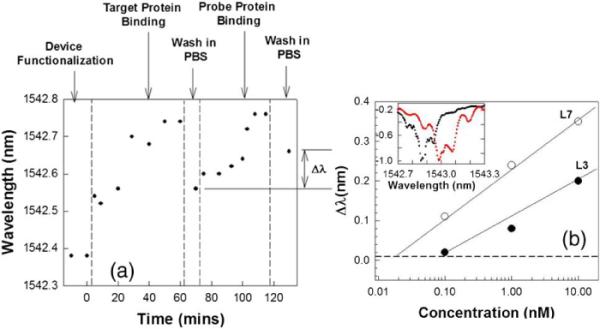
(a) Resonance wavelength of L3 PC microcavity at different steps in the binding sequence. The resonant wavelength shift of interest is denoted by Δλ. (b) Resonance shift of L3 (filled circles) and L7 PC microcavities (open circles) with probe antibody binding. Dashed line indicates the detection limit. Inset shows peak wavelength shift on binding. (inset) Normalized intensity data showing shift in L7 microcavity resonance from black to red curve upon addition of 0.1 nM probe antibodies.