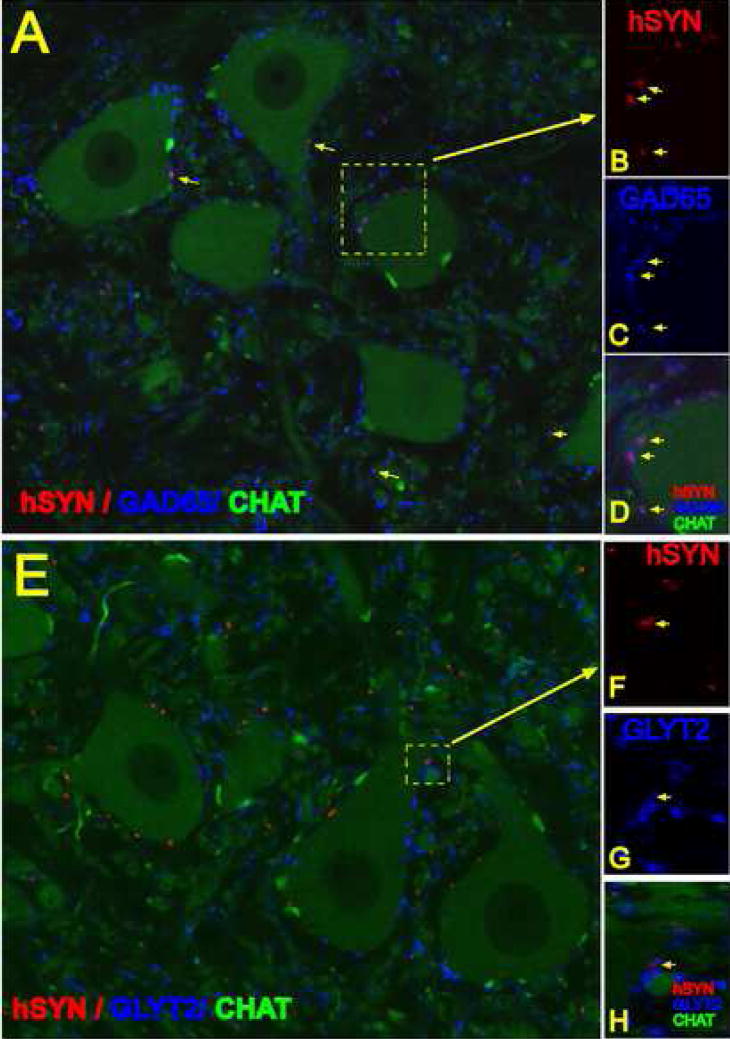
Figure 7 A – H.
A, B, C, D- single confocal optical images taken from section at 3 months after grafting and stained with hSYN (red), CHAT (green) and GAD65 (blue) antibodies. The majority of hSYN terminals showed colocalization with GAD65 (B, C, D-yellow arrows).
E, F, G, H - single confocal optical images taken from sections at 3 months after grafting and stained with hSYN (red), CHAT (green) and GLYT2 (blue) antibodies. Only occasional colocalization of hSYN and GLYT2 antibody was noted (F, G, H - yellow arrow).

