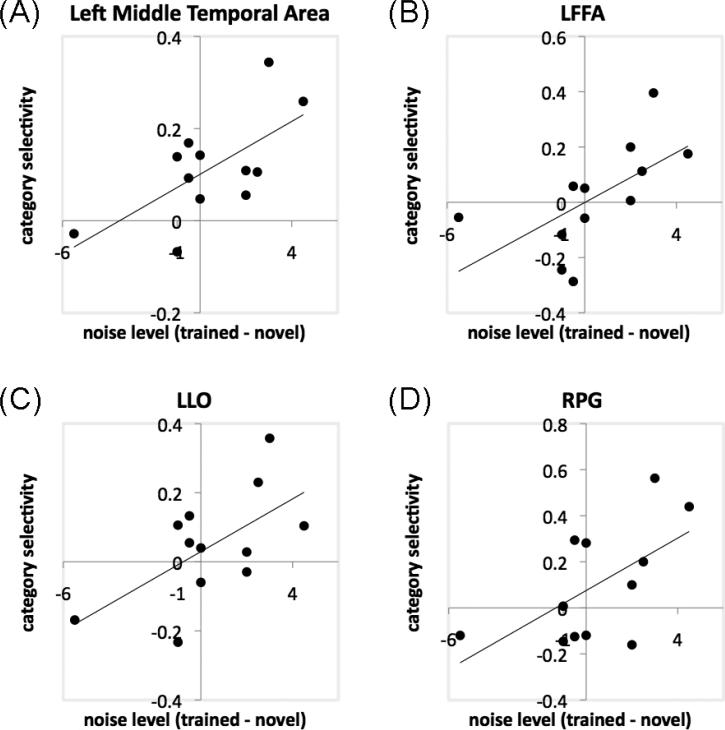
Figure 6.
Scatter plots showing significant correlations for the PE group between behavioral improvement in shape matching (indicated by the difference in noise level for 80% matching accuracy for trained and novel object categories after training) and category selectivity during shape matching (defined by the Category × Training contrast) in the left middle temporal area (A), LFFA (B), LLO (C) and RPG (D).

