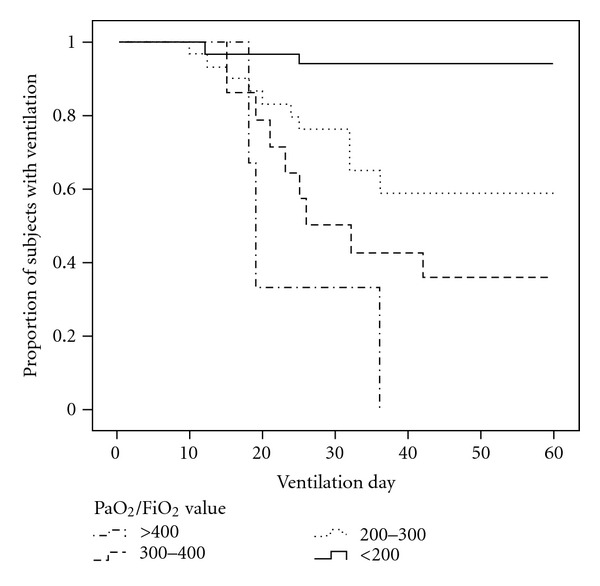
Figure 3.

Kaplan-Meier curve showing the proportion of patients with ventilation over time according to stratified PaO2/FiO2 values.

Kaplan-Meier curve showing the proportion of patients with ventilation over time according to stratified PaO2/FiO2 values.