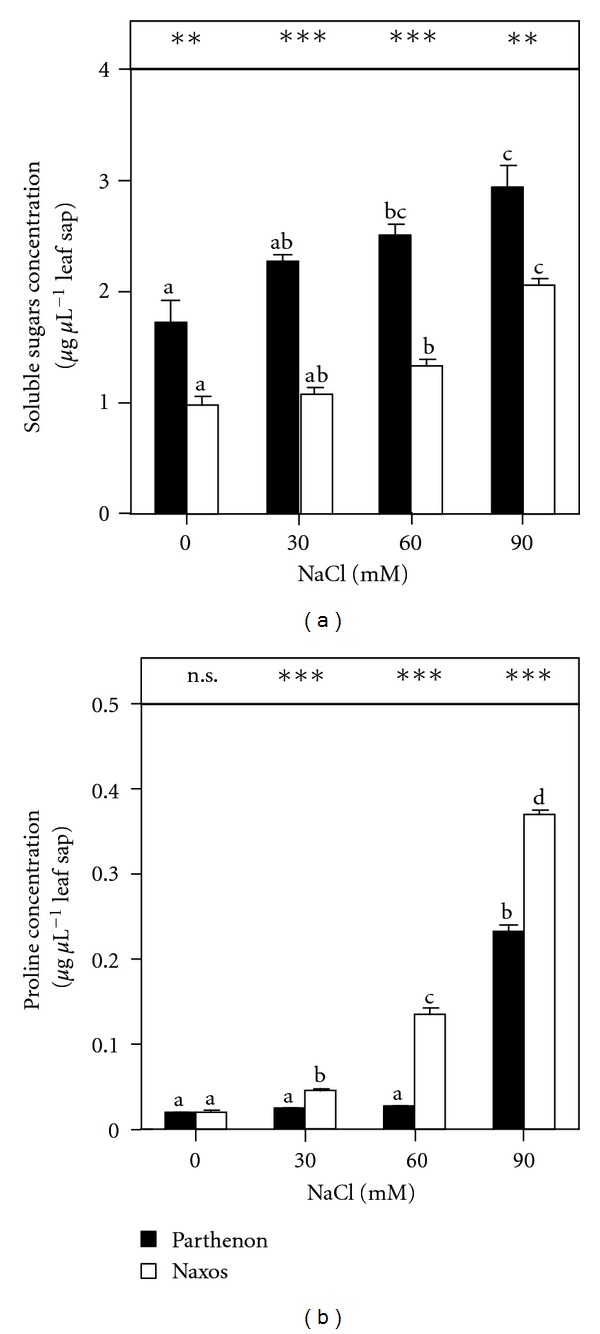
Figure 1.

Leaf sap soluble sugars (a) and proline (b) concentrations of broccoli plants grown under saline conditions (0, 30, 60, or 90 mM NaCl) for 15 days (n = 5 ± SE). Column values with the same letters are not significantly different (P < 0.05 for soluble sugars and P < 0.01 for proline, Tukey's test). The significance of the difference between the two cultivars was given according to the Student's t-test, with *P < 0.05, **P < 0.01, ***P < 0.001; n.s: nonsignificant.
