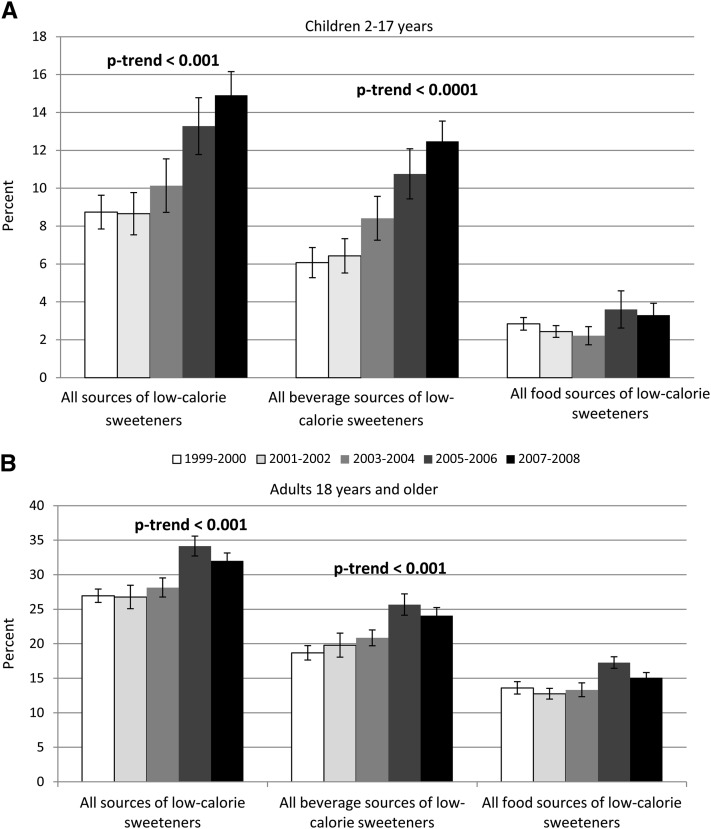
FIGURE 2.
Mean (±SE) percentage of children (n = 16,716) and adults (n = 26,737) who reported consuming food or beverage sources of low-calorie sweeteners in each NHANES cycle from 1999–2000 to 2007–2008. Linear trends were calculated by using Wald's chi-square test. Consumers are defined as those who reported consuming ≥1 food or beverage containing low-calorie sweeteners during the 24-h recall.

