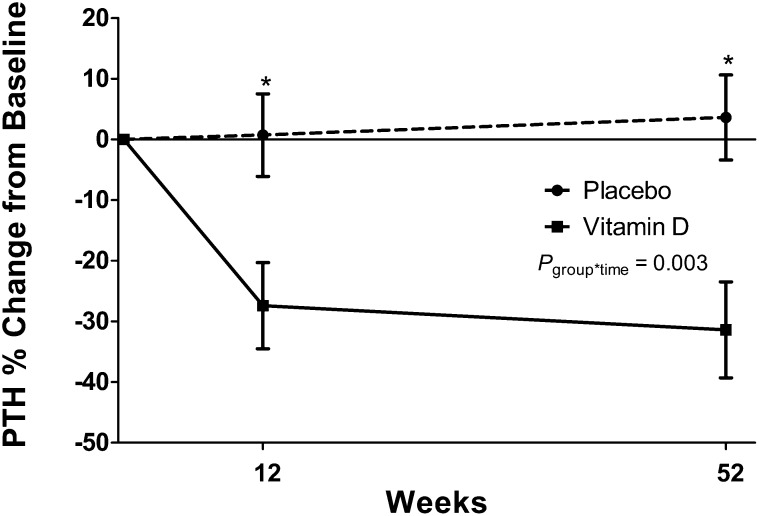
FIGURE 5.
Least-squares mean (±SEM) percentage changes in PTH concentrations from baseline by time and treatment group in patients with elevated baseline PTH concentrations (>70 pg/mL) adjusted for baseline 25(OH)D concentrations. Compared with placebo group (n = 24, dashed line), the vitamin D group (n = 22; solid line) experienced a significantly greater percentage decrease in PTH at weeks 12 and 52. *P-group difference < 0.05 (ANCOVA). group*time, group-by-time interaction. PTH, parathyroid hormone.

