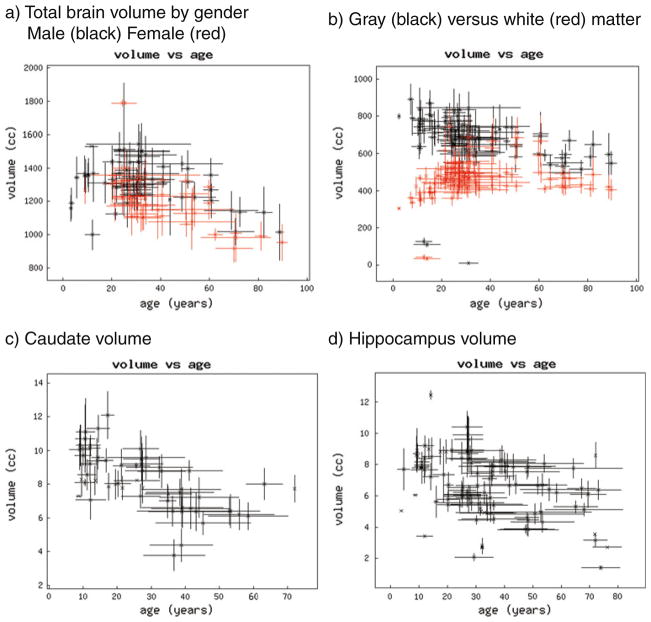
Fig. 4.
Graphical plots of sample query results. For these plots of group volume, each group is represented by the mean age (on the x axis) and mean volume (on the y axis). The x-axis bars represent the standard deviation of the reported group age; the y-axis bar represents the reported standard deviation of the volume. a Results of the volumetric results returned for subject groups indicated as ‘normal’ for total brain, plotted by gender. b Co-plot of total cerebral gray and white matter. c Plot of total caudate nucleus volume by age. d Plot of total hippocampus volume by age

