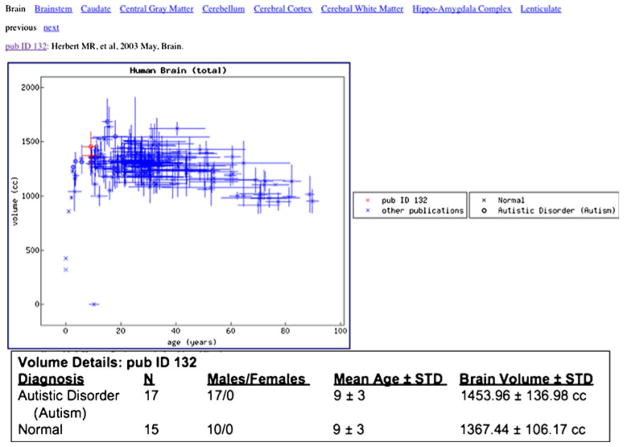
Fig. 5.
Demonstration of the ‘Paper View’ display for Herbert et al. 2003. Total brain volume is plotted; with the observations of this specific paper shown in red. Comparison volumes from the remainder of the database are shown in blue, and represent data for normal subjects (x) as well as groups with the diagnosis of Autistic Disorder (o)

