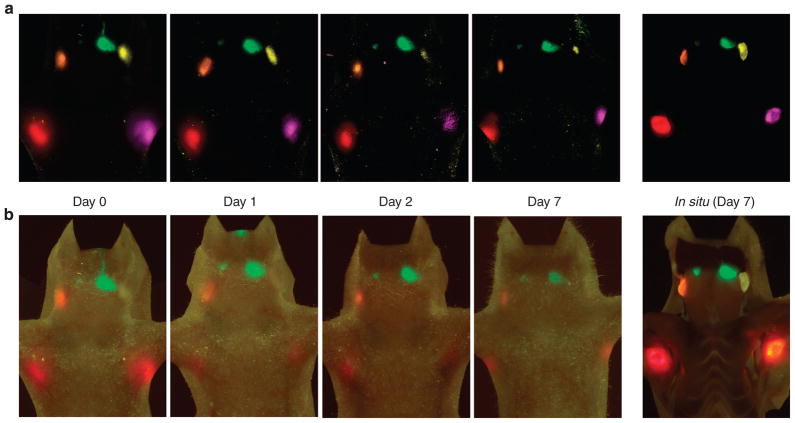
Figure 3. Serial in vivo fluorescence images at day 0 to day 7 and in situ fluorescence images at day 7.
On day 1, signal is reduced compared to day 0. From day 1 to day 7, however, there are less marked reductions in signal, except in the left deep neck lymph node (Qdot 565), which becomes harder to see because of autofluorescence. In situ fluorescence images at day 7 clearly show all lymph nodes containing Qdots. (a) Spectral fluorescence images, (b) real-time multicolor fluorescence images.

