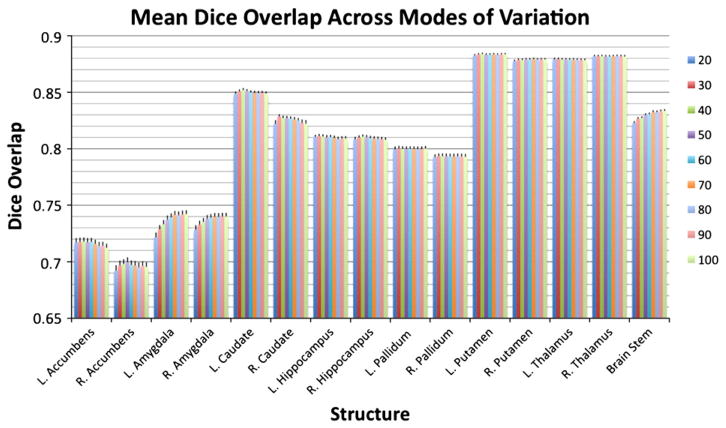
Fig. 6.
The mean Dice overlap between the filled surfaces and the manual labels for each of the 15 structures when restricting the fitting to 20, 30, 40, 50, 60, 70, 80, 90 and 100 modes of variation (in different colours — see key on the right hand side). All structures used the FAST method for boundary correction and had both prior constants εi and εs as specified in Table 2.

