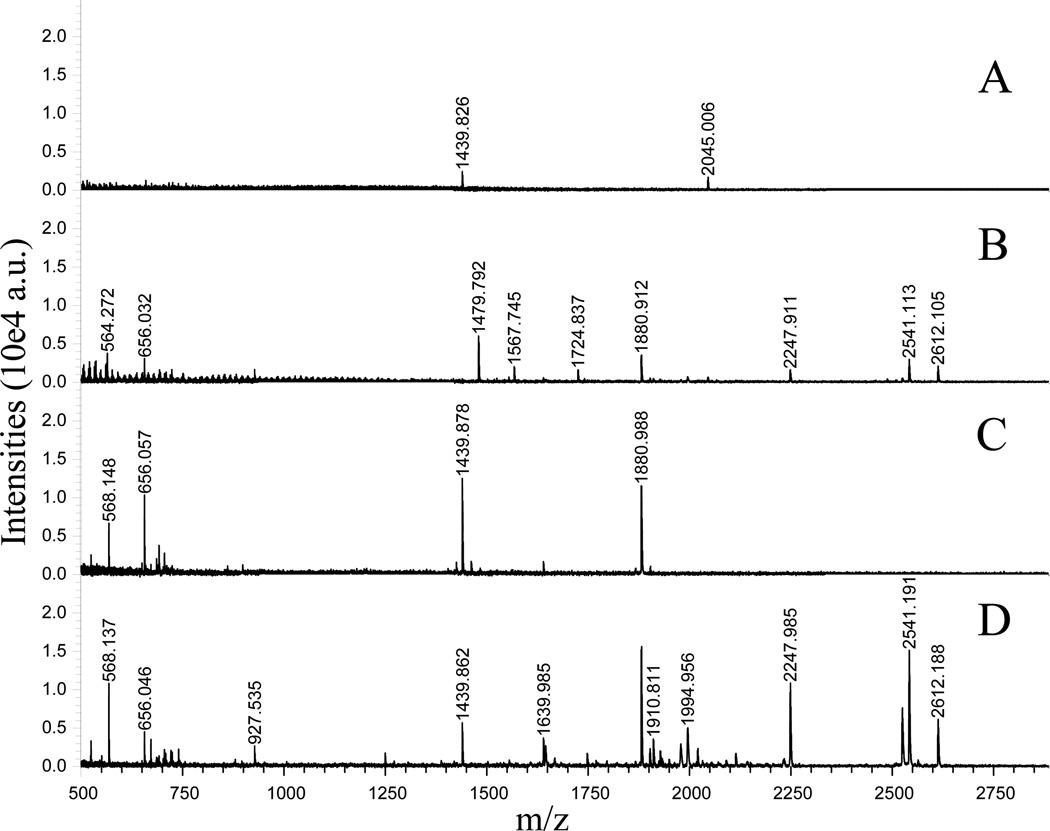
Figure 2. Comparison of regular CIEF and IPG-CIEF separations with BSA tryptic peptides.
Panels A and B: Representative mass spectra showing the peptide profiles collected from an earlier and a later fraction after regular CIEF separation. Panels C and D: Representative mass spectra showing the peptide profiles collected from corresponding fractions after IPG-CIEF separation.

