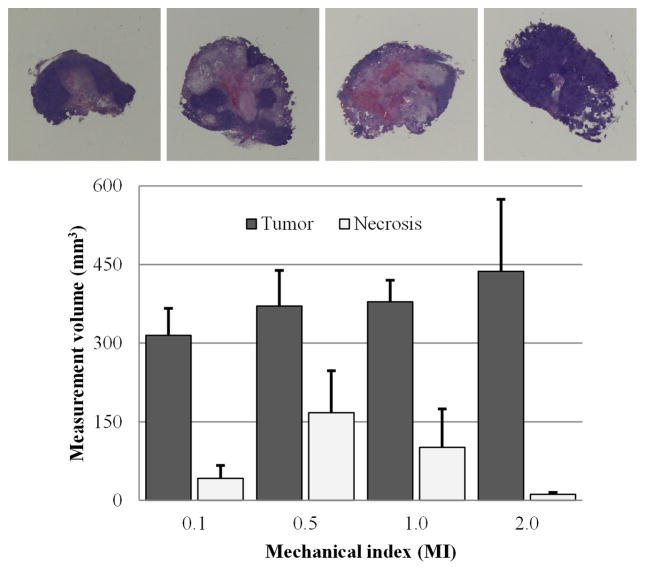
Figure 6. In vivo characterization of tumor necrosis per volume after combination MB-mediated US therapy.
(a) MB-mediated US treatment with various MIs was investigated in combination with chemotherapy. Shown are necrosis and tumor size from the varying treatments on the last day of experimentation. Representative histology slide are shown for each varying MI: (b) MI=0.1, (c) MI=0.5, (d) MI=1.0 and (e) MI=2.0. Control tumors are shown in (e) drug alone, (f) ultrasound alone, and (g) saline control. The control tumors were excluded from calculation due to ulcerations. MB-mediated US treatment with an MI of 0.5 resulted in the highest percentage of tumor necrosis.

