
Figure 2.
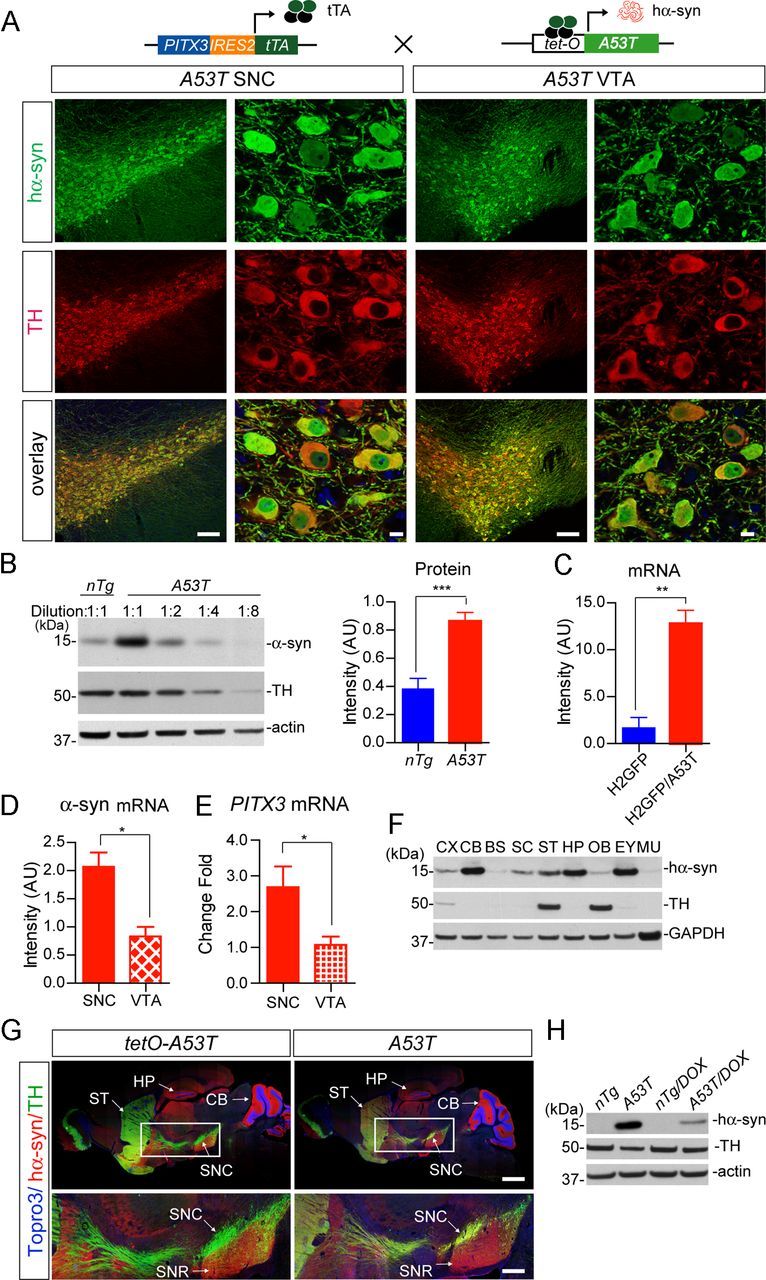
Target expression of PD-related human A53T α-syn in mDA neurons. A, The diagram depicts the generation of A53T inducible transgenic mice through crossbreeding PITX3-IRES2-tTA and tetO-A53T mice. Immunofluorescent images show the selective expression of human α-syn (hα-syn) in the mDA neurons at both the SNC and VTA regions of 1-month-old PITX3-IRES2-tTA/tetO-A53T (A53T) mice. The expression of human A53T α-syn (green) was revealed by an antiserum (syn211) specifically against hα-syn. The mDA neurons were visualized by TH immunostaining (red), and the nucleus was marked by Topro3 staining (blue). Scale bars: low-magnification images, 100 μm; high-magnification images, 10 μm. B, Western blot determines the level of α-syn overexpression in the midbrain homogenate from 1-month-old A53T transgenic mice compared with littermate nTg mice using an antiserum (C20) recognizing both human and mouse α-syn. A dilution series of midbrain homogenates from A53T mice were used for Western blot analysis. β-Actin (actin) and TH were used as the loading control. The Bar graph estimates the level of α-syn overexpression (normalized against the TH expression) in the midbrain of 1-month-old A53T mice compared with that of age-matched littermate nTg mice (n ≥ 3 per genotype). Data were presented as mean ± SEM. ***p < 0.001. C, qRT-PCR determines the levels of α-syn mRNA expression in isolated mDA neurons from 2-week-old H2GFP and littermate PITX3-IRES2-tTA/ tetO-H2Bj-GFP/tetO-A53T (H2GFP/A53T) transgenic mice (n > 1000 cells per genotype). The primers for α-syn were designed to amplify both mouse and human α-syn. GAPDH was used to normalize the gene expression from different samples. Data were presented as mean ± SEM. **p < 0.01. D, E, qRT-PCR determines the levels of α-syn and PITX3 mRNA expression in isolated mDA neurons from the SNC and VTA of 2-week-old H2GFP/A53T transgenic mice (n > 1000 cells from SNC and VTA, respectively). GAPDH was used to normalize the gene expression from different samples. Data were presented as mean ± SEM. *p < 0.001. F, Regional distribution of hα-syn in the brain, eye, and skeletal muscle of 6-month-old A53T transgenic mice using a human α-syn-specific antibody (syn211). An equal amount of protein was loaded into each lane. GAPDH was used as the loading control. G, Images show staining of hα-syn (red), TH (green), and Topro3 (blue) in the sagittal section of 1-month-old tetO-A53T single-transgenic and A53T double-transgenic mice. Scale bars: top, 1 mm; bottom, 400 μm. H, Suppression of exogenous hα-syn expression in striatum homogenate from 1-month-old A53T mice treated with DOX starting from early embryonic stages. CX, Cerebral cortex; CB, cerebellum; BS, brainstem; SC, spinal cord; ST, striatum; HP, hippocampus; OB, olfactory bulb; EY, eye; MU, skeletal muscle; SNR: substantia nigra pars reticulate.