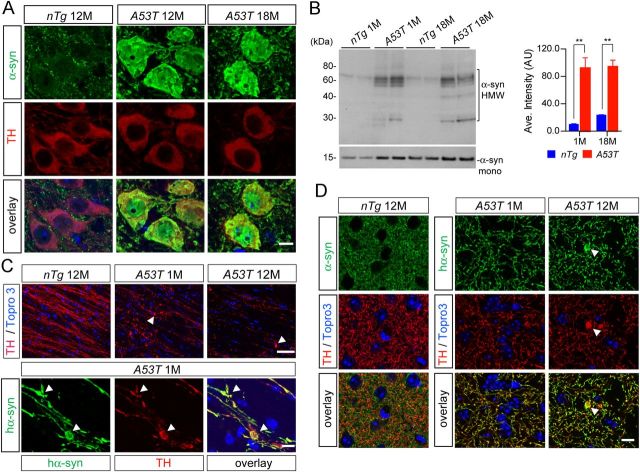
Figure 5.
Subcellular distribution of A53T α-syn in the mDA neurons. A, α-syn (green) and TH (red) staining in the SNC of 12- and 18-month-old A53T and 12-month-old nTg mice. Topro3 (blue) staining was used to mark the nucleus. Scale bar, 10 μm. B, Western blot analysis shows the formation of α-syn-positive HMW bands in the midbrain homogenate of 1- and 18-month-old A53T and littermate control nTg mice. The bar graph indicates an increase of accumulation of HMW α-syn in the brain of A53T mice. Data were presented as mean ± SEM. **p < 0.01. C, Human α-syn (green) and TH (red) staining in the sagittal sections of globus pallidus of 1- and 12-month-old A53T and 12-month-old nTg mice. Arrowheads point to the swelling axon fragments. The nucleus was visualized by Topro3 (blue) staining. Scale bars: top, 50 μm; bottom, 10 μm. D, α-syn (green) and TH (red) staining in the striatum of 12-month-old nTg mice as well as 1- and 12-month-old A53T mice. The α-syn in A53T mice was revealed by staining with a human α-syn-specific antiserum (syn211). Arrowheads point to a swelling axon terminal. The nucleus was visualized by Topro3 (blue) staining. Scale bar, 10 μm.

