
Figure 7.
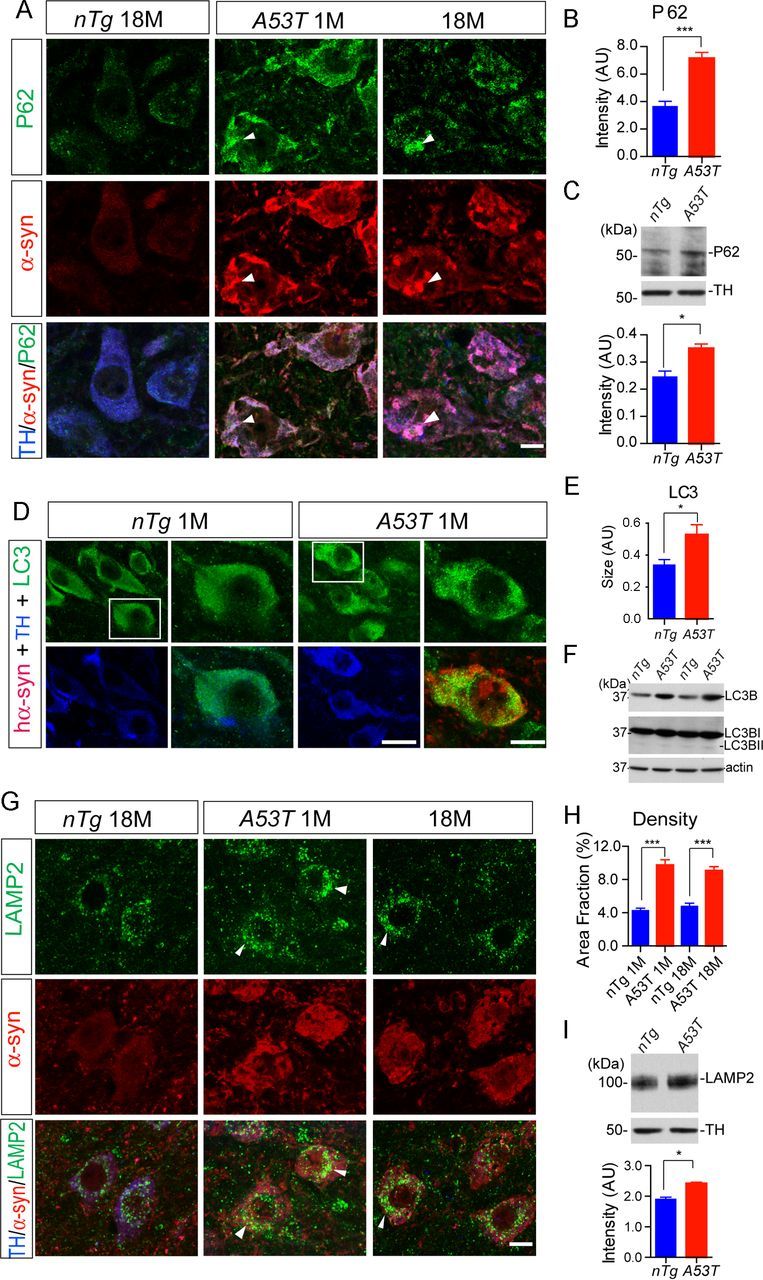
Overexpression of α-syn alters autophagosome and lysosome marker protein expression in the mDA neurons. A, P62 (green), α-syn (red), and TH (blue) costaining in the midbrain sections of 18-month-old nTg mice as well as 1- and 18-month-old A53T mice. Arrowheads point to areas with substantial overlap of P62 and α-syn staining. Scale bar, 10 μm. B, Quantification of P62 staining intensity in the TH-positive neurons of 1-month-old nTg and A53T mice (n = 3 animals per genotype; n ≥ 20 neurons per animal). Data were presented as mean ± SEM. ***p < 0.001. C, Western blot analysis shows the expression of P62 in the midbrain homogenate of 1-month-old A53T and littermate nTg mice. TH was used as loading control. The bar graph depicts the P62 expression levels normalized with TH in the midbrain homogenate of 1-month-old A53T and littermate nTg mice (n = 3 per genotype). Data were presented as mean ± SEM. *p < 0.05. D, LC3 (green), human α-syn (red), and TH (blue) costaining in the midbrain section of 1-month-old nTg and littermate A53T mice. Scale bars: low-magnification images, 50 μm; high-magnification images, 10 μm. E, The size of LC3-positive puncta in the TH-positive neurons of 1-month-old nTg and A53T mice (n = 3 animals per genotype; n ≥ 20 neurons per animal). Data were presented as mean ± SEM. *p < 0.05. F, Western blot shows the expression of LC3BI and LC3BII in the midbrain homogenate of 1-month-old A53T and nTg mice. G, LAMP2 (green), α-syn (red), and TH (blue) costaining in the midbrain sections of 1-month-old nTg and littermate A53T mice. Scale bar, 10 μm. H, Density of LAMP2-positive puncta in the TH-positive neurons of 1-month-old nTg and A53T mice (n = 3 animals per genotype; n ≥ 20 neurons per animal). Data were presented as mean ± SEM. ***p < 0.001. I, Western blot analysis shows the expression of LAMP2 in the midbrain homogenate of 1-month-old A53T and littermate nTg mice. TH was used as the loading control. The bar graph depicts the LAMP2 expression levels normalized with TH in the midbrain homogenate of 1-month-old A53T and littermate nTg mice (n = 3 per genotype). Data were presented as mean ± SEM. *p < 0.05.