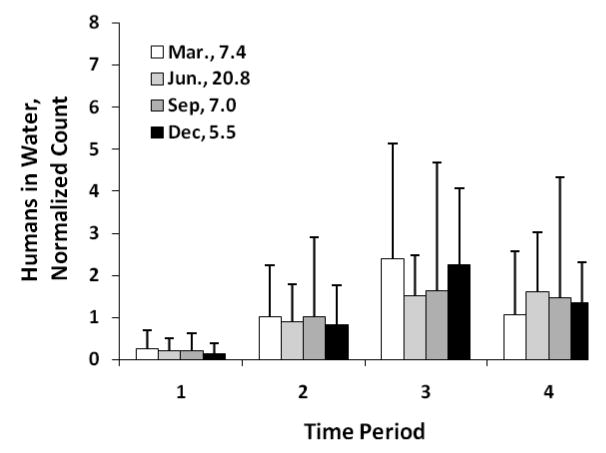
Figure 4.

Intra-day distribution of humans in water by period of day and season. Error bars correspond to one standard deviation. The normalized numbers are the ratios of the period count divided by the average daily count (listed in the figure legend). Period 1 corresponds to 7:00 to 11:00, period 2 to 11:01 to 13:00, period 3 to 13:01 to 15:00, and period 4 to 15:01 to 19:00.
