
Figure 2. Significant increase in IL-13Rα1 and IL-13Rα2 surface protein expressio n on IEC from UC and CRC lesions.
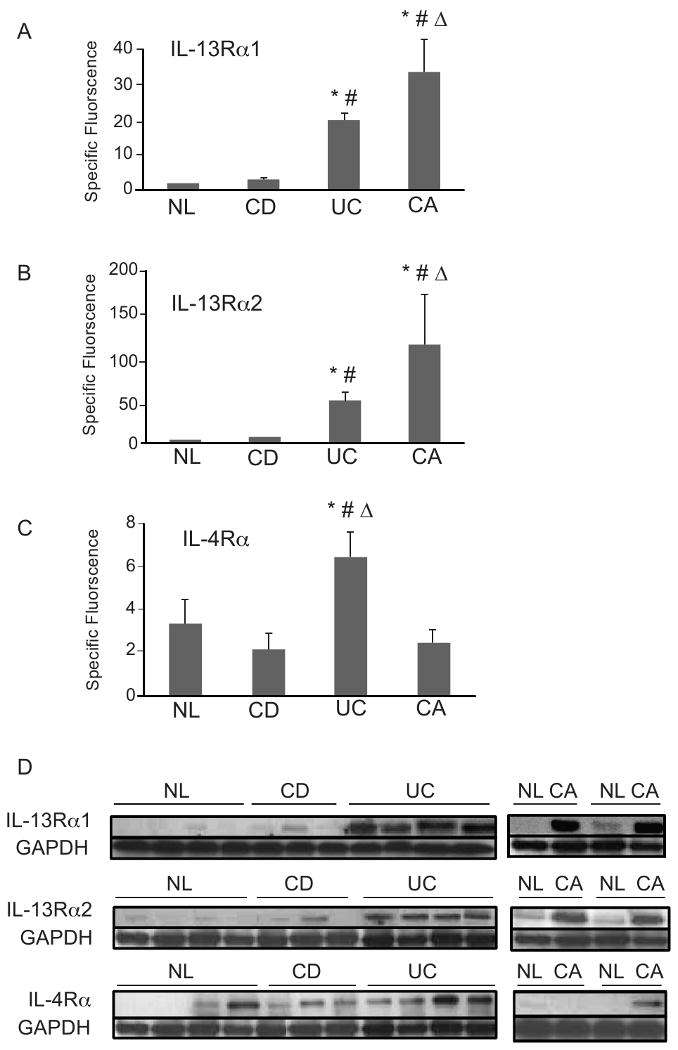
Fsp were calculated from 6 control, 4 CD, 5 UC, and 3 CRC tumor samples. A) IL-13Rα1 expression: * p ≤ 0.05 for UC and CRC compared with control, # p ≤ 0.05 for UC and CRC compared to CD, Δ p ≤ 0.05 for CRC compared to UC. B) IL-13Rα2 expression: *p ≤ 0.05 for CRC compared to control, # p ≤ 0.05 for CRC compared to CD, Δ p ≤ 0.05 for CRC compared to UC. C) IL-4Rα expression: * p ≤ 0.05 for UC compared to control, # p ≤ 0.05 for UC compared to CD, Δ p ≤ 0.05 for UC compared to CA. D) IEC cells from healthy control, CD, UC and CRC were isolated and whole cell extracts prepared. Extract normalized for total protein concentration, fractioned by SDS-PAGE and immunoblotted with antibodies directed against IL-13Rα1, IL-13Rα2, and IL-4Rα. GAPDH loading control is shown.