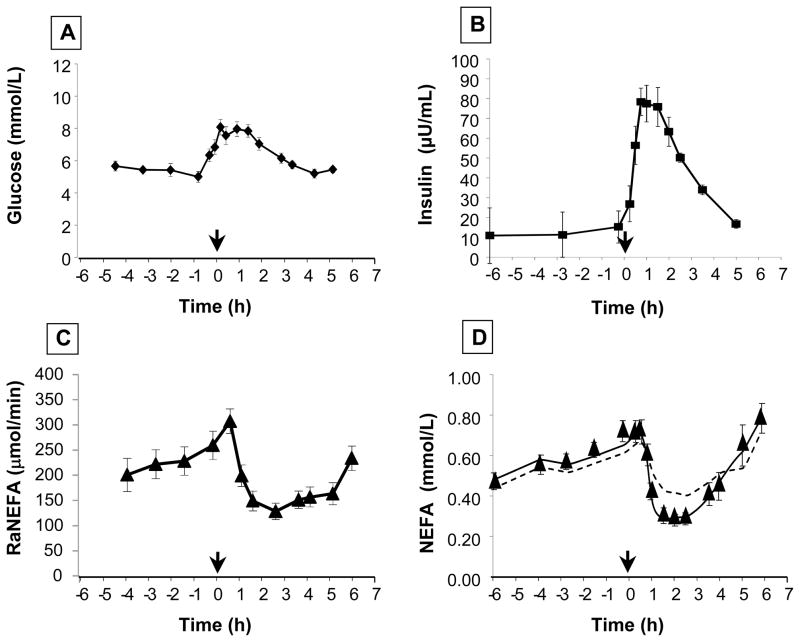
FIGURE 1. Concentrations of glucose and insulin, and RaNEFA before and after a standardized meal. Concentrations of NEFA with model fits.
Mean plasma concentrations of (A) glucose and (B) insulin, and (C) mean total fatty acid delivery to the plasma (RaNEFA) in subjects with metabolic syndrome (n = 15) fed a standardized meal at t=0 (12 noon). For details of meal, see Methods. The lines on graphs A–C represent simple linear interpolations between data points. By contrast, the lines on graph D are model solutions. The dotted line represents the model with constant plasma NEFA FCR and is incapable of accounting for the experimental data (filled triangles) representing the mean plasma NEFA concentration time course after the test meal. This model was constrained using the directly measured total RaNEFA as the only input to plasma NEFA and the value of the constant FCR was optimized during the fitting process. The solid line, by contrast, is the model solution that includes insulin-sensitive fatty acid uptake. Parameter values for this fit for the Puptake rate law (see text) are DelayFacUptake = 11 min; kmaxFacUptake = 0.063 min−1; KmFacUptake = 14 pmol/kgBW and hFacUptake = 4.2; kdiff = 0.112 min−1.

