
FIGURE 3. INEFA model diagram.
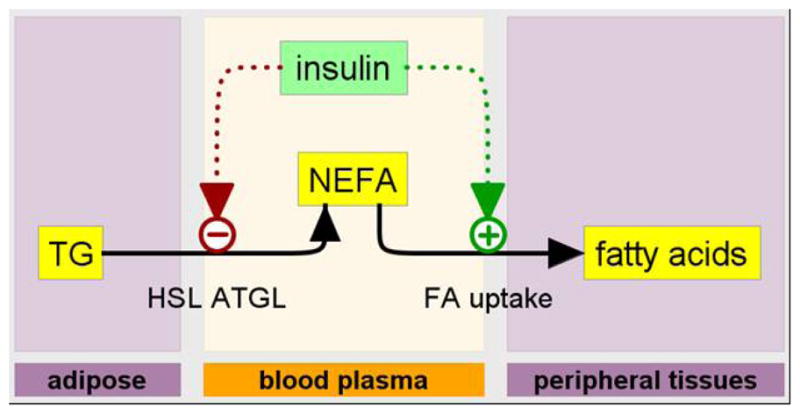
The INEFA model of insulin-regulated plasma NEFA dynamics including two insulin-regulated processes: 1) fatty acid release from adipocytes and 2) fatty acid uptake by peripheral tissues (adipose, heart, skeletal muscle). Model state variables are molecules (indicated by molecule names in rectangles) in particular physiological places (adipose, blood plasma, and peripheral tissues) indicated by the labeled “swim lanes.” Dotted arrows represent the physiological distribution and intracellular signaling delays associated with the two insulin-mediated regulatory control systems.