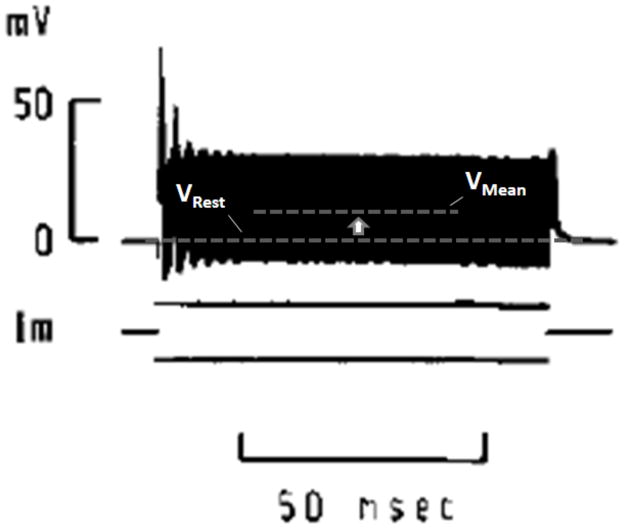
Figure 1.
Figure from a 1975 study by Bromm showing an intracellular recording of a frog node of Ranvier in response to 10 kHz intracellular stimulation (reprinted with permission [32]). Note the elevation of mean membrane potential above the resting potential. The intracellular current stimulation had zero DC component. High frequency fluctuations appear as a solid bar due to temporal resolution.

