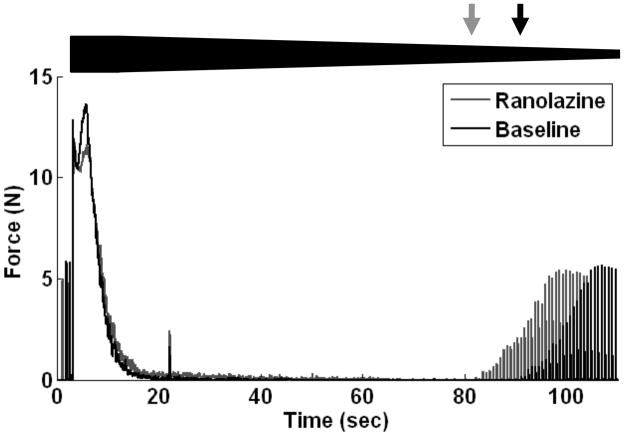
Figure 8.
Typical complete HFS conduction block trial using a frequency of 20 kHz both at baseline and after injection of ranolazine. The relative HFS amplitude is shown with the bold line in the figure. Black and gray arrows indicate the block threshold amplitude for the baseline and ranolazine traces, respectively.

