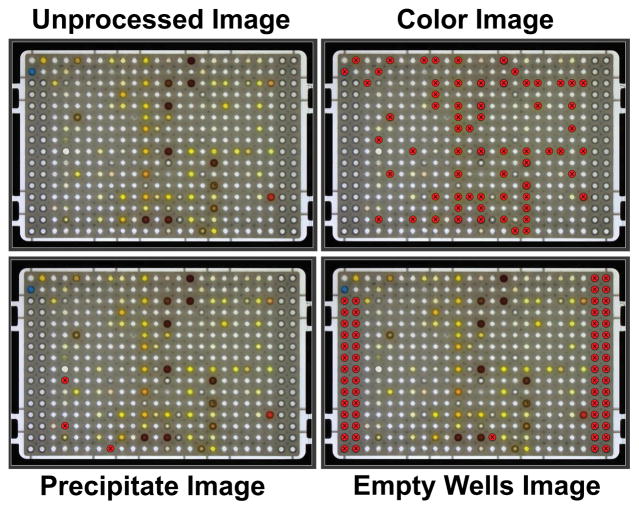
Figure 5. Results of HIAPI-CM Analysis, as viewed through the User Interface (UI).
An unprocessed image (top left) is presented with other annotated images resulting from HIAPI-CM analysis. The UI displays a circle over wells which HIAPI-CM has identified as problematic. An image of wells annotated as containing colored sample (top right), wells containing precipitate image (bottom left) and empty wells image (bottom right) provide a quick reference for users to locate artifacts within the microtiter plate. The UI also allows the user to update the HIAPI-CM database.

