
Figure 4.
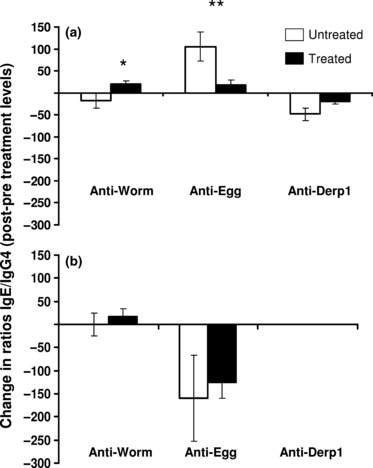
Comparison of changes in the ratios. Mean changes in ratios IgE/IgG4 for treated (black columns) and untreated (white columns) people are shown for the high infection area (a) and the low infection area (b) with standard error of means. Asterisks represent significant differences between treated and untreated people at *P < 0·05 and **P < 0·01 obtained from the analysis of variance after allowing for the variation owing to the potential confounding variables – host age, sex and pre-treatment infection intensity.