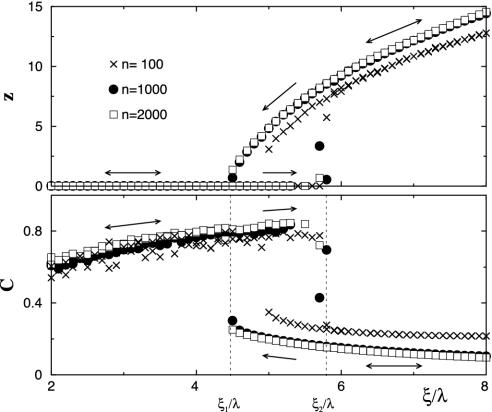
Fig. 1.
Average degree z (Upper) and clustering coefficient C (Lower) from numerical simulations with η = 0.001 and λ = 0.1 for populations of size n = 100, 1,000, and 2,000. The process was discretized as follows. At each time step, with probability η, a long-range link was added between two nodes taken at random. With probability ξ, a local search process was attempted on a randomly selected site. Finally, a set of randomly selected links were removed, their number being drawn from a Poisson distribution with mean λc(t)/2. After n such time steps, simulation time was increased by one unit. Each point in the plots was obtained by taking averages over the nodes and over time, in the stationary state (for each run, we let the system equilibrate for a time teq = 3,000/λ, which is much larger than typical relaxation times). Once the stationary state for a particular value of ξ was reached and averages were taken, the value of ξ was changed to ξ + Δξ without reinitializing the network, thus “sweeping” the ξ axis first from left to right (Δξ > 0) and then from right to left (Δξ < 0), as shown by the arrows.

