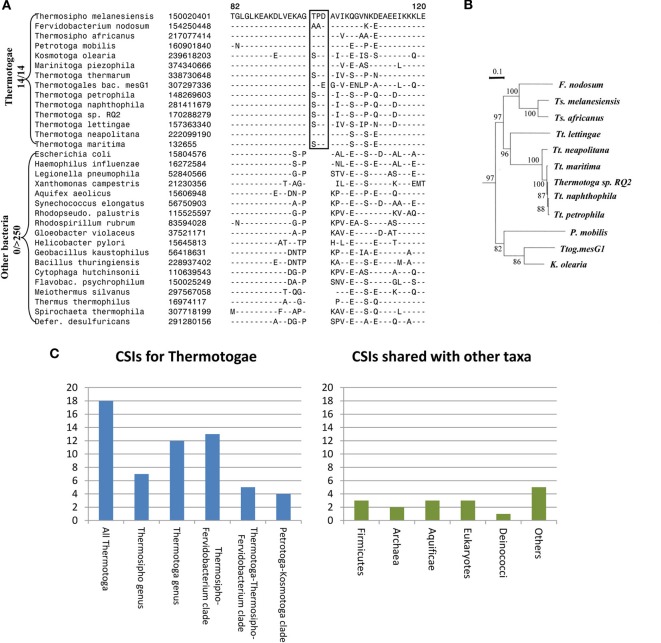
Figure 1.
Evolutionary relationships among Thermotogae species based upon CSIs and a Phylogenetic Tree. (A) Partial sequence alignment for the ribosomal protein L7 showing a 3 aa CSI (boxed) that is specific for all detected species of the Thermotogae phylum. The dashes in the alignment (−) indicate amino acid identity with the corresponding residue in the top line; (B) A maximum likelihood tree for the 12 sequenced Thermotogae species based upon concatenated sequences for 12 conserved proteins. (C) A summary diagram showing the species specificities of different CSIs identified for the Thermotogae group of species. The left panel highlights the CSIs that are specific for the entire Thermotogae phylum or its sub-groups, whereas the right panel indicates the CSIs that were also present in some non-Thermotogae organisms. Figures 1A,B modified from Gupta and Bhandari (2011).

