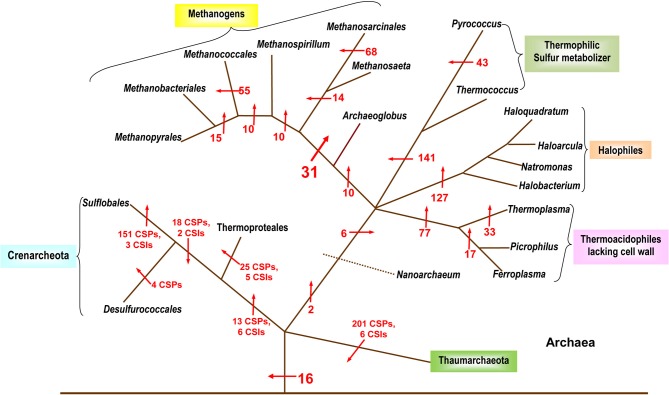
Figure 2.
A summary diagram showing the various molecular markers that have been identified for the Archaeal kingdom and its subgroups. The arrows indicate the suggested evolutionary stages where the proteins unique for a particular taxa are proposed to have been introduced. The numbers beside the arrows indicate the number of CSIs and CSPs specific for the various taxa (these numbers indicate CSPs unless otherwise noted). The branching pattern shown is based solely upon the distribution patterns of CSPs and CSIs. Modified from Gao and Gupta (2007) and Gupta and Shami (2011).

