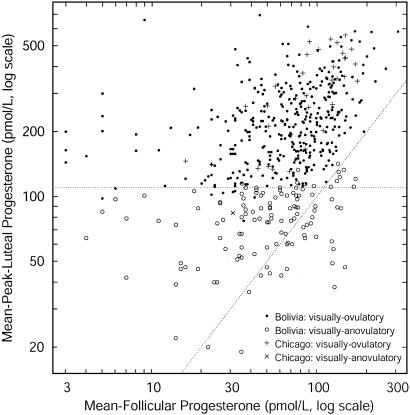
Fig. 1.
Scatter plot of mPL vs. mF progesterone. Visually ovulatory (• and +) and visually anovulatory (○ and ×) cycles are well separated by a mPL threshold of 110 pmol/liter (dashed horizontal line). Above the dashed diagonal line, mPL > mF. Only those cycles that are visually ovulatory and fall above both dashed lines were included in these analyses.

