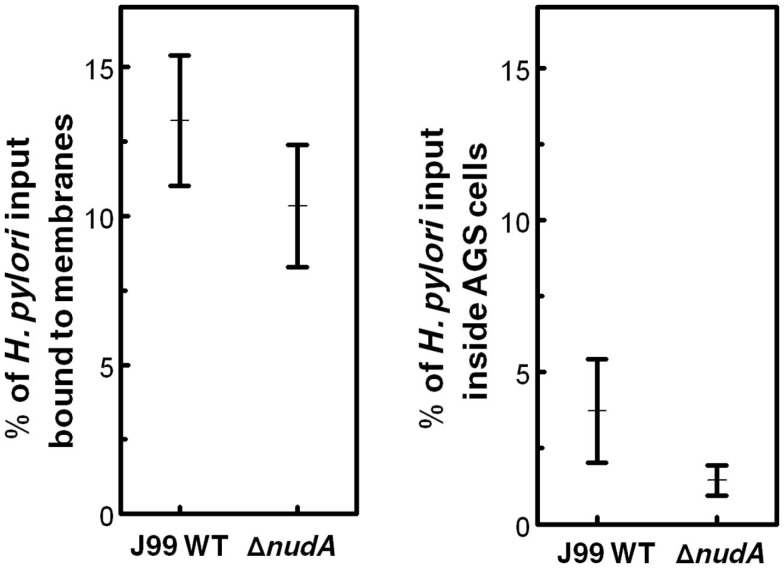
Figure 4.
Helicobacter pylori NudA invasin and AGS cell entry determined using the “classical” gentamicin protection assay. Values are Means ± SEM. Left panel shows that the density of H. pylori bound to AGS cell membranes and expressed as the percentage of bacteria inoculated into the AGS monolayer was not significantly different in WT J99 and the ΔnudA mutant (p = 0.35). Right panel shows that the density of intracellular H. pylori expressed as the percentage of bacteria inoculated into the AGS monolayer was not significantly different in WT J99 and the ΔnudA mutant after saponin treatment (p = 0.23).

