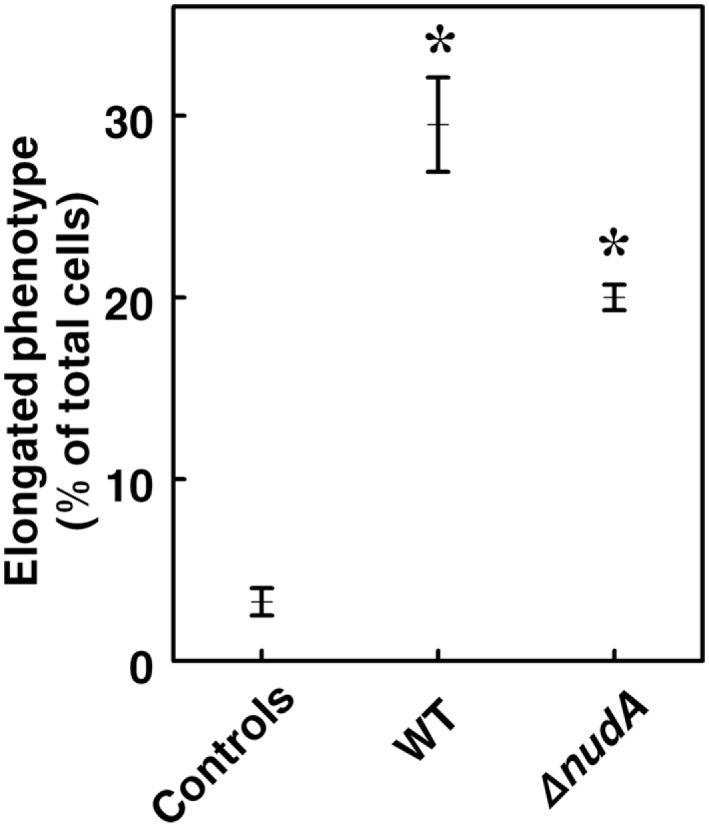
Figure 6.

Percentage of AGS cells with elongated (“hummingbird”) phenotype in cells infected with WT J99 and ΔnudAH. pylori compared to control uninfected cells. Values are Means ± SEM. The percentage of cells with abnormal phenotype is higher in both types of infection (*p < 0.001), and also significantly higher in infection with WT H. pylori than with the ΔnudA mutant (p < 0.01).
