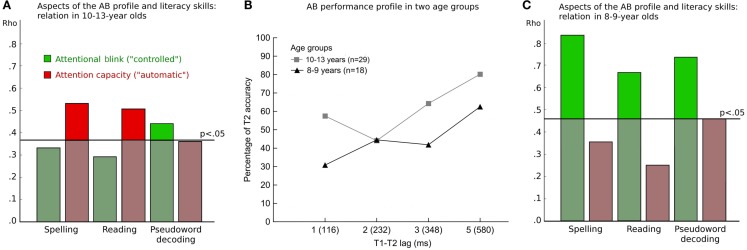
Figure 3.
(A) Bar plot showing the absolute rank correlation between measures derived from the attentional blink (AB) profile [shown in (B)] and indices of literacy in children aged 10–13 years. Literacy scores were based on tests challenging spelling, reading, and pseudoword decoding. Attention profile measures were obtained by calculating (i) the relative decrease at lag 2 yielding in an index of the AB impairment, which characterizes the cost effect of “controlled” attention to the first target (T1), and (ii) the relative decrease at lag 1, where a relatively spared second target (T2) deficit measures the capacity for processing two targets in a row, with no intervening distractors. The horizontal black line indicates the 5% significance level of rank correlation coefficients in this group. (B) Percentage of accurate T2 report given T1 identification at four temporal lags of the AB task. Values represent means of 29 older children (gray squares) and 18 younger children (black triangles). (C) Bar plot showing the absolute rank correlation between the same measures described in (A), calculated across children in the younger (8–9 years) group. The horizontal black line indicates the 5% significance level of rank correlation coefficients in this sample.

