
Figure 2.
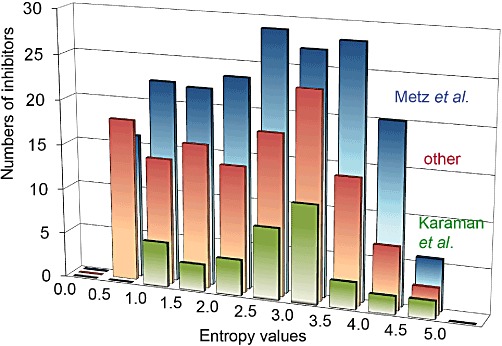
Distribution of the selectivity entropies of inhibitors in profiling datasets. The bars indicate the numbers of inhibitors in the indicated datasets with entropies between values at the x-axis. The distribution indicated ‘other’ originates from an activity-based dataset of 127 cpds profiled on 222 kinases (Uitdehaag, 2010). For the Metz et al. (2011), dataset, numbers on the y-axis need to be multiplied by 20. All three independent datasets have a similar entropy distribution.