Figure 1.

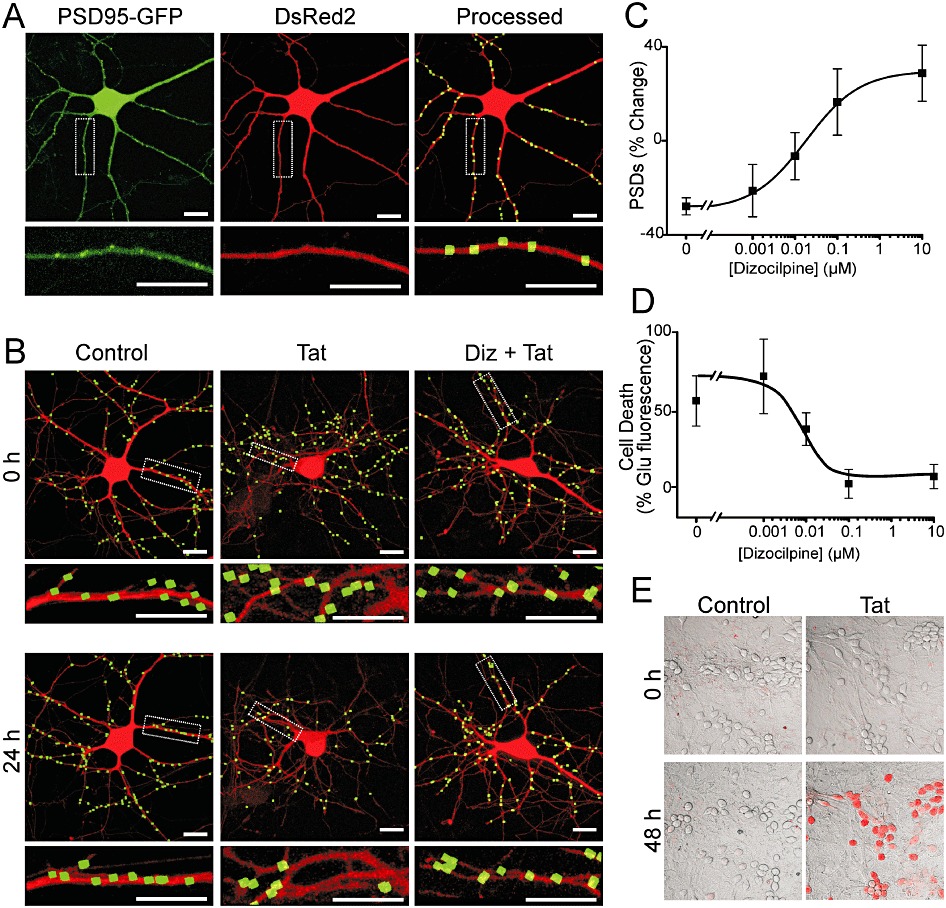
NMDA receptor activity is required for Tat-mediated neuronal death and synapse loss. (A) Representative confocal images of neurons were collected and processed as described in Methods. Maximum projection images show a neuron expressing PSD95-GFP and DsRed2. PSD95-GFP puncta were identified by filtering compressed z-stacks (8 µm) of confocal images for fluorescent intensity and size and counted when in contact with a mask derived from the DsRed2 image. Labelled PSDs were dilated and overlaid on the DsRed2 image for visualization purposes (processed). The insets are enlarged images of the boxed region. Scale bars represent 10 µm. (B) Processed images show neurons before (0 h) and after (24 h) no treatment (control), treatment with 50 ng·mL−1 Tat (Tat), or treatment with 10 µM dizocilpine 15 min before and during treatment with Tat (Diz + Tat). The insets are enlarged images of the boxed regions. Scale bars represent 10 µm. (C) Graph shows the % change in the number of PSD95-GFP puncta (mean ± SEM) for cells treated with 50 ng·mL−1 Tat for 24 h in the presence of the indicated concentrations of dizocilpine (n≥ 7 for each data point). The curve was fit with a logistic equation of the form %PSD change = A2+ (A1− A2)/(1 + (X/EC50)p) where X = dizocilpine concentration, A1=−28 ± 2% PSD change without dizocilpine, A2= 17 ± 4% PSD change at a maximally effective dizocilpine concentration and p = slope factor. EC50 was calculated using a nonlinear, least squares curve-fitting programme. EC50 and p were 9.6 nM and 0.5, respectively. (D) Graph shows cell death in cultures treated with 50 ng·mL−1 Tat for 48 h in the presence of the indicated concentrations of dizocilpine (n≥ 5 for each data point). Cell death was quantified by PI fluorescence as described in Methods. PI fluorescence was normalized to that induced by treatment with 1 mM glutamate for 48 h, which kills virtually all neurons in this culture. The mean ± SEM % change in PI fluorescence is plotted against increasing concentrations of dizocilpine. The curve was fit with a logistic equation of the form % change in PI fluorescence = A1+ (A2− A1)/(1 + (X/EC50)p) where X = dizocilpine concentration, A1=−1 ± 5% PI fluorescence change at a maximally effective dizocilpine concentration, A2= 54 ± 9% PI fluorescence change without dizocilpine, and p = slope factor. EC50 was calculated using a nonlinear, least squares curve-fitting programme. EC50 and p were 10.4 nM and – 0.7, respectively. (E) Representative images show differential-interference-contrast micrographs of hippocampal neurons in culture with PI fluorescence (red) superimposed. Images from control and Tat-treated (50 ng·mL−1) cultures are shown before (0 h) and after (48 h) treatment.
