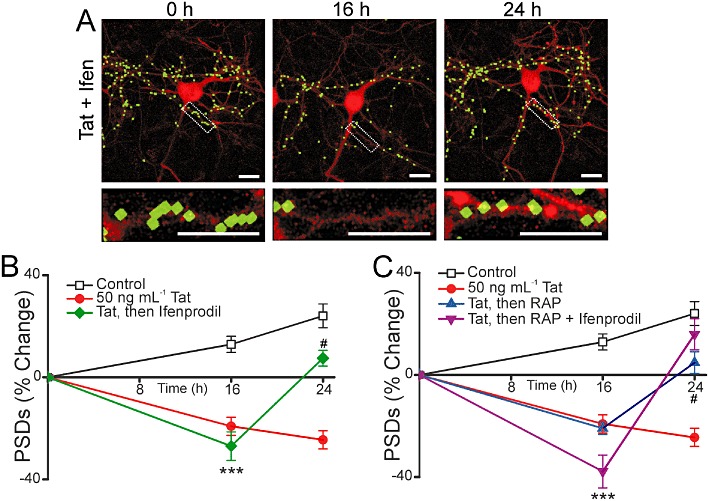
Figure 7.

Ifenprodil evokes synapse recovery after Tat-induced loss. (A) Representative processed images of a neuron before (0 h) and 16 or 24 h after treatment with 50 ng·mL−1 Tat; 10 µM ifenprodil was applied after 16 h in the presence of Tat. The insets are enlarged images of the boxed region. Scale bars represent 10 µm. (B–C) Graphs summarize % change in number of PSDs in the absence (control) or presence of 50 ng·mL−1 Tat for 24 h. (B) After 16 h exposure to Tat cells were then left untreated or treated with 10 µM ifenprodil. (C) After 16 h exposure to Tat cells were then left untreated, treated with 50 nM RAP alone or treated with RAP + 10 µM ifenprodil. Ifenprodil was added to neurons 15 min before 50 nM RAP. Data are expressed as mean ± SEM. ***P < 0.001 relative to control at 16 h; #P < 0.05 relative to 50 ng·mL−1 Tat at 24 h (anova with Tukey's post-test).
