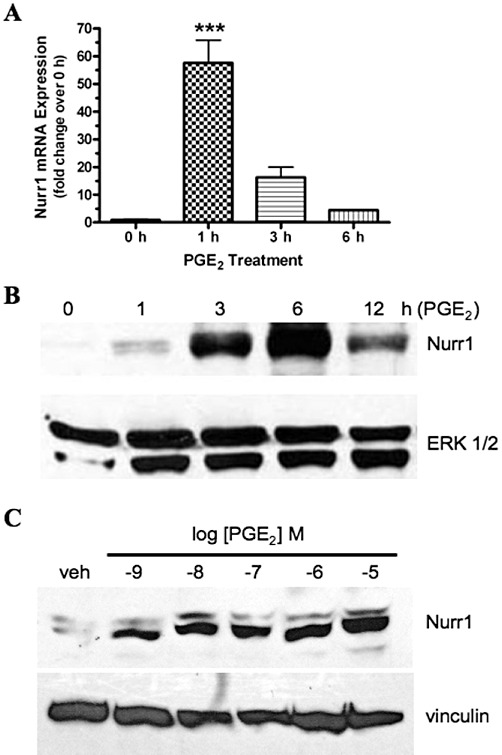
Figure 1.

Time course for the PGE2-stimulated up-regulation of Nurr1 mRNA (A) and concentration-response (B) and time course for the protein expression (C) of Nurr1 in HEK cells stably expressing the human EP1 receptor. (A) HEK-EP1 cells were incubated with 1 µM PGE2 at 37°C for the indicated times and then RNA was isolated and used for quantitative real-time PCR with primers specific for either Nurr1 or GAPDH. Data were analysed by the comparative ΔΔCt method, relative to the expression of GAPDH. Data are the means ± SEM (n= 4) of the pooled data from two independent experiments each done in duplicate. ***P < 0.001; compared with time 0; one-way anova, followed by Bonferroni post-test. (B) HEK-EP1 cells were incubated with 1 µM PGE2 at 37°C for the indicated times and were subjected to immunoblot analysis using antibodies against human Nurr1 or ERK 1/2 as described in the methods section. (C) HEK-EP1 cells were incubated with either vehicle (veh) or the indicated concentrations of PGE2 for 3 h at 37°C and were subjected to immunoblot analysis using antibodies against human Nurr1 or vinculin. Immunoblots are representative from one of three independent experiments.
