Figure 5.

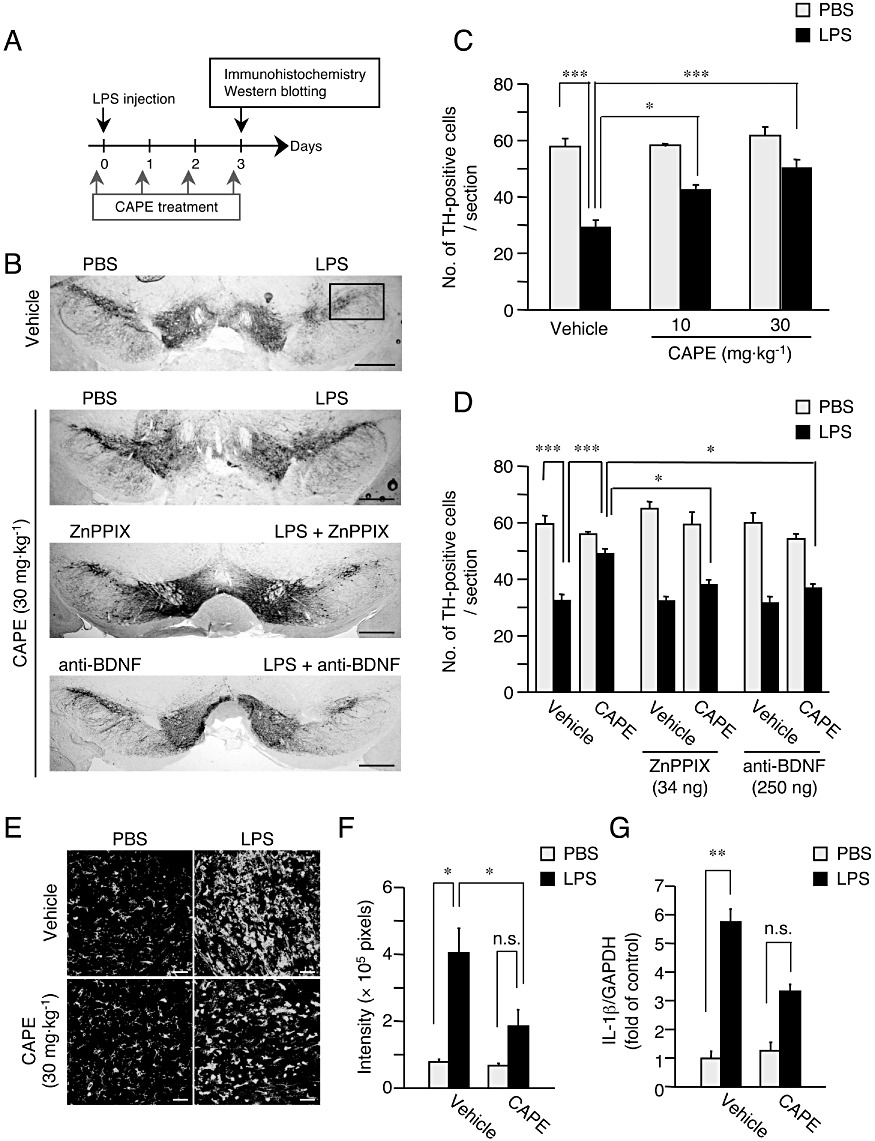
HO-1 and BDNF contribute to the neuroprotective effect of CAPE in vivo. (A) Experimental schedule of LPS injection and CAPE administration. The first CAPE administration was made 30 min before LPS injection. (B) Representative photographs showing mouse midbrain sections containing SNpc at 3 days after intranigral injection of 3 µg LPS in 1 µL PBS, in the presence or absence of ZnPPIX (34 ng) and anti-BDNF (250 ng). An equal volume of PBS in the presence or absence of ZnPPIX and anti-BDNF was injected into the contralateral side. Mice received daily administration of CAPE (10 or 30 mg·kg−1, i.p.) or vehicle (corn oil containing 1% DMSO) for four consecutive days from the day of LPS injection (the first CAPE administration was made 30 min before LPS injection). Positions of the frame for counting the number of TH-positive cells are included in the photograph of a section from vehicle-treated animal. Scale bar, 500 µm. (C) Summary of the effect of CAPE on changes in the number of nigral dopaminergic neurons. n= 5 for each treatment. *P < 0.05, ***P < 0.001 (main effect of LPS: F(1,24) = 62.3, P < 0.0001; main effect of CAPE: F(2,24) = 8.578, P= 0.0015; interaction between effects of LPS and CAPE: F(2,24) = 3.585, P= 0.0434). (D) Summary of the effect of ZnPPIX and anti-BDNF on CAPE-induced protection of nigral dopaminergic neurons. n= 5 for each treatment. *P < 0.05, ***P < 0.001 (main effect of LPS: F(1,48) = 7.663, P < 0.0001; main effect of CAPE: F(1,48) = 7.663, P < 0.01; main effect of (ZnPPIX and anti-BDNF): F(2,48) = 4.206, P < 0.05; interaction between effects of CAPE and (ZnPPIX and anti-BDNF): F(2,48) = 7.757, P < 0.01). (E) Effect of CAPE on the increase of isolectin B4-positive cells in SNpc induced by LPS injection. Mice received daily intraperitoneal administration of CAPE (30 mg·kg−1) for four consecutive days starting from the day of LPS injection (the first CAPE administration was made 30 min before LPS injection). Scale bar, 50 µm. (F) Semi-quantitative analysis of isolectin B4-positive cell area (pixels). n= 5 for each treatment. *P < 0.05 (main effect of LPS: F(1,36) = 40.90, P < 0.0001; main effect of CAPE: F(1,16) = 11.35, P= 0.0040; interaction between effects of LPS and CAPE: F(1,16) = 9.15, P= 0.0080). (G) Real-time quantitative RT-PCR analysis of the expression level of mRNA for IL-1β at 6 h after LPS injection. CAPE at 30 mg·kg−1 was administered 30 min before LPS injection. n= 5 for each treatment. **P < 0.01; n.s., not significant (main effect of LPS: F(1,16) = 181.08, P < 0.0001; main effect of CAPE: F(1,16) = 34.20, P < 0.0001; interaction between effects of LPS and CAPE: F(1,16) = 34.20, P < 0.0001).
