Figure 7.

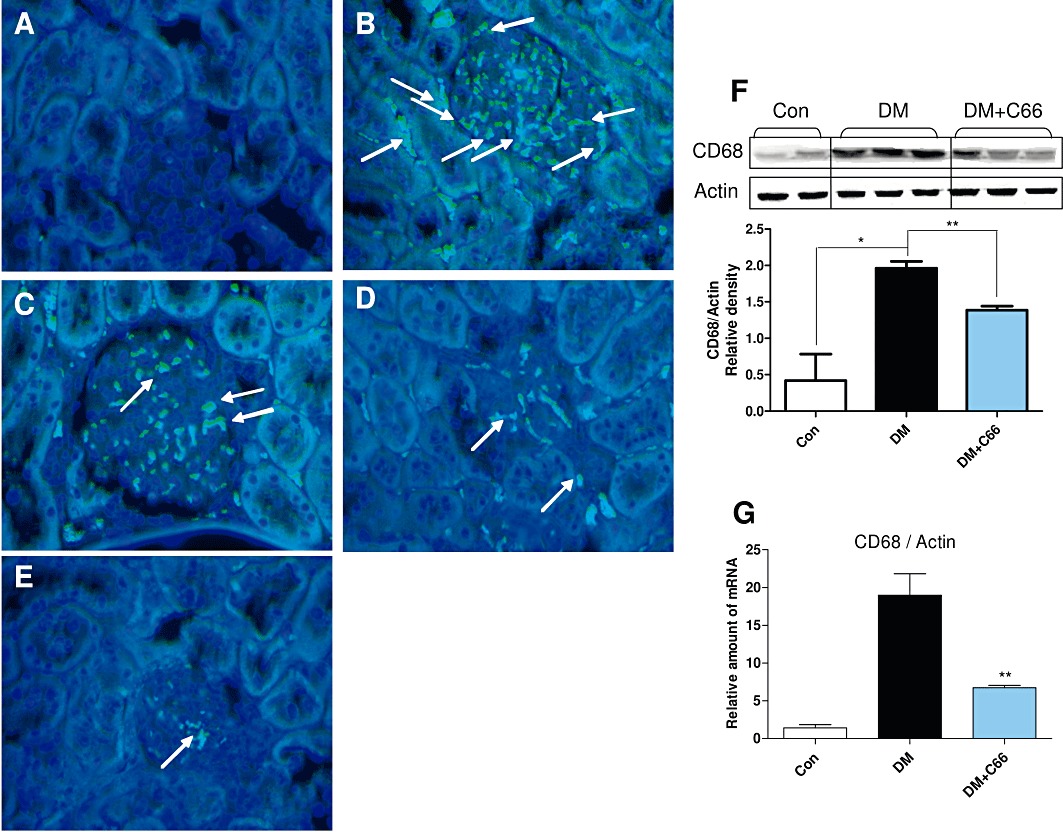
C66 inhibits renal macrophage infiltration in diabetic rats. Rats were treated, and kidney samples were prepared as described in Methods. (A–E) Macrophage infiltration was evaluated using anti-CD68 antibodies. (A) Control group. (B) DM group. (C) DM + C66 0.2 mg·kg−1 group. (D) DM + C66 1.0 mg·kg−1 group. (E) DM + C66 5.0 mg·kg−1 group. Arrows indicate stained interstitial inflammatory cells. Magnification, ×200. A representative animal out of five studied in each group is shown. (F–G) The rat kidney tissues from control group (Con), diabetes group (DM) and DM + C66 5 mg·kg−1 group were collected and homogenated. The protein level of CD68 was detected by Western blot. Actin was used as a loading control. The column figures show the normalized optical density of CD68/Actin (F). The mRNA expression of CD68 was estimated by the RT-qPCR and normalized to β-actin mRNA content (G). Bar graph shows mean ± SEM in each group (*P < 0.05, **P < 0.01).
