

Abstract
BACKGROUND AND PURPOSE
Glucocorticoids appear to control Na+ absorption in pulmonary epithelial cells via a mechanism dependent upon serum and glucocorticoid-inducible kinase 1 (SGK1), a kinase that allows control over the surface abundance of epithelial Na+ channel subunits (α-, β- and γ-ENaC). However, not all data support this model and the present study re-evaluates this hypothesis in order to clarify the mechanism that allows glucocorticoids to control ENaC activity.
EXPERIMENTAL APPROACH
Electrophysiological studies explored the effects of agents that suppress SGK1 activity upon glucocorticoid-induced ENaC activity in H441 human airway epithelial cells, whilst analyses of extracted proteins explored the associated changes to the activities of endogenous protein kinase substrates and the overall/surface expression of ENaC subunits.
KEY RESULTS
Although dexamethasone-induced (24 h) ENaC activity was dependent upon SGK1, prolonged exposure to this glucocorticoid did not cause sustained activation of this kinase and neither did it induce a coordinated increase in the surface abundance of α-, β- and γ-ENaC. Brief (3 h) exposure to dexamethasone, on the other hand, did not evoke Na+ current but did activate SGK1 and cause SGK1-dependent increases in the surface abundance of α-, β- and γ-ENaC.
CONCLUSIONS AND IMPLICATIONS
Although glucocorticoids activated SGK1 and increased the surface abundance of α-, β- and γ-ENaC, these responses were transient and could not account for the sustained activation of ENaC. The maintenance of ENaC activity did, however, depend upon SGK1 and this protein kinase must therefore play an important but permissive role in glucocorticoid-induced ENaC activation.
Keywords: epithelial Na+ channel, serum and glucocorticoid-regulated kinase 1, 3-phosphatidylinositol phosphate kinase, TORC2, H441 cells, pulmonary Na+ absorption
Introduction
The controlled absorption of Na+ and water from the liquid film that covers the lung and airway epithelia is critical to the integrated functioning of the respiratory tract, and this process depends upon epithelial Na+ channels (ENaC), transport proteins composed of three subunits (α-, β- and γ-ENaC) that form the selective channels that allow electrogenic Na+ entry in absorptive epithelia (Canessa et al., 1993; 1994; Knowles and Boucher, 2002; Matthay et al., 2002; Boucher, 2007; channel nomenclature follows Alexander et al., 2011). Glucocorticoids are physiologically important regulators of this pulmonary Na+ transport process (see Matalon and O'Brodovich, 1999; Matthay et al., 2002; Olver et al., 2004) and such steroid hormones appear to control ENaC via a mechanism dependent upon phosphoinositide-3-kinase (PI3K), a regulatory kinase that catalyses the formation of phospholipid second messengers, primarily phosphatidylinositol-3,4,5-trisphosphate (PIP3) and phosphatidylinositol-3,5-bisphosphate (PIP2). Early studies of renal epithelia showed that PI3K inhibitors suppressed Na+ absorption, apparently by reducing the number of functional Na+ channels in the apical membrane (Păunescu et al., 2000). This control over the surface abundance of α-, β- and γ-ENaC is now attributed to serum and glucocorticoid-inducible kinase 1 (SGK1), a PI3K-dependent protein kinase that appears able to inhibit the removal of ENaC subunits from the plasma membrane. Activation of SGK1 is therefore thought to allow α-, β- and γ-ENaC to remain in the membrane leading to a rise in its Na+ conductance and increased Na+ absorption (Blazer-Yost et al., 1998; 2003; Record et al., 1998; De La Rosa et al., 1999; 2003; Păunescu et al., 2000; Debonneville et al., 2001). However, not all data support this hypothesis since sgk1 gene deletion causes only mild dysfunction of renal Na+ handling without preventing the hormonal control of colonic Na+ absorption, and also fails to induce an overt pulmonary phenotype (Wulff et al., 2002; Rexhepaj et al., 2006; Fejes-Toth et al., 2008; Lang et al., 2009). Moreover, pharmacological inhibition of PI3K and/or SGK1 causes only modest (10–20%) inhibition of basal Na+ transport in mouse cortical collecting duct cells (Mansley and Wilson, 2010a,b).
The role of PI3K/SGK1 in the control of ENaC activity is therefore not fully understood (Lang et al., 2009; Loffing and Korbmacher, 2009) and, to some extent, this reflects the fact that the PI3K inhibitors used in earlier studies (LY294002, wortmannin) are now known to exert many non-specific actions (Bain et al., 2007). Moreover, whilst it was clear that the activation of SGK1 by PI3K is dependent upon phosphoinositide-dependent protein kinase 1 (PDK1), a PI3K-dependent protein kinase that catalyses the phosphorylation of SGK1 at Thr256 (Kobayashi and Cohen, 1999; Park et al., 1999; Bayascas and Alessi, 2005), it was also known that this reaction required the prior phosphorylation of SGK1 at Ser422 and the kinase responsible for this critical event was unknown (Kobayashi and Cohen, 1999; Park et al., 1999). This situation has now been changed by the development of a new generation of selective inhibitors of PI3K, such as PI103 (see Raynaud et al., 2007) and SGK1 (GSK659034; see Sherk et al., 2008) and by the identification of the target of rapamycin signalling complex 2 (TORC2) as the kinase responsible for the phosphorylation of SGK1 at Ser422 (García-Martínez and Alessi, 2008; Lu et al., 2010). Moreover, pharmacological inhibitors of TORC2 are also available (TORIN1, see Thoreen et al., 2009) and these provide an effective means of inactivating SGK1 (García-Martínez and Alessi, 2008; Thoreen et al., 2009; Mansley and Wilson, 2010a).
The present study takes advantage of these developments in order to evaluate the role of PI3K – TORC2 – SGK1 pathway in the glucocorticoid-induced activation of ENaC in an epithelial cell line (H441) derived from the human distal airway (see Lazrak and Matalon, 2003; Clunes et al., 2004; Ramminger et al., 2004; Brown et al., 2008; Lazrak et al., 2009; Althaus et al., 2010).
Methods
Cell culture
H441 cells were routinely maintained in RPMI medium supplemented with 8.5% foetal bovine serum (FBS), 8.5% newborn calf serum, 2 mM glutamine, 5 µg·mL−1 transferrin, 5 ng·mL−1 selenium and an antibiotic/antimycotic mixture (Sigma Chemical Co., Poole, Dorset, UK). For experimentation, cells were removed from culture flasks (trypsin/EDTA) and were plated onto six-well plates (for analyses of extracted protein) or glass cover slips (for electrophysiological studies). Cells on six-well plates were grown to ∼80% confluence (5–6 days) before the growth medium was replaced with a fully defined medium identical to that described earlier except that it contained 20 nM insulin and the serum components were replaced with FBS (8.5%) that had been dialysed to remove hormones/growth factors. Glucocorticoid-deprived cells were maintained in this medium for ∼24 h before being used in experiments while dexamethasone-treated cells were exposed to medium containing 0.2 µM dexamethasone, as detailed in the text. Cells used in electrophysiological experiments were maintained in standard growth medium until cellular attachment occurred (2–3 h). The cells were then briefly washed, and exposed to glucocorticoid-free or dexamethasone-supplemented medium, as detailed in the text.
Electrophysiology
Membrane currents were recorded (Axopatch 200B amplifier, Axon Digidata 1440A interface, pClamp 10 software, Axon Instruments, Foster City, CA, USA) from cells held under voltage clamp in the perforated patch recording configuration (Horn and Marty, 1988) using amphotericin to gain electrical access to the cell interior (Clunes et al., 2004). The pipette filling solution contained (in mM) NaCl, 10; KCl, 18; K gluconate, 92; MgCl2, 0.5; EGTA, 1; HEPES 10; its pH was adjusted to 7.2 with KOH, which brought [K+] to 113.3 mM. The standard bath solution contained (in mM) NaCl 140; KCl 4.5; MgCl2 1; CaCl2 2.5; HEPES, 10; glucose 5; its pH was adjusted to 7.4 with NaOH, which brought [Na+] to 144.4 mM. Experiments were undertaken at room temperature (∼22°C) and the equilibrium potential for Na+ (ENa) and K+ (EK) were therefore 67.8 mV and −81.9 mV respectively. Recordings were initiated once the access resistance (Ra) had fallen to a stable value below 50 MΩ (10–15 min). Ra and input capacitance (Cm) were monitored throughout each experiment and all presented data are from preparations in which these parameters remained stable. We achieved 40–50% compensation of the voltage drop across Ra, and because the lowest value of membrane resistance was ∼0.5 GΩ, the residual error in the holding potential (VHold) was always <∼4%; this was assumed to be negligible. In all experiments, the membrane currents evoked by ramp changes in VHold (−113 mV to +87 mV, 2 s) were initially recorded during exposure to the standard bath solution and the measurement then repeated after 20–30-s exposure to 10 µM amiloride. The amiloride-sensitive component of the total membrane current (IAmil) was isolated by digitally subtracting the current that persisted in the presence of amiloride from the corresponding record of control current. Previous work from this laboratory has shown that selective Na+ currents can only be recorded from H441 cells growing in contact with each other (Brown et al., 2008) and the electrophysiological data included in the present study are therefore derived entirely from cells growing in groups of three to six cells. The values of Cm measured under these conditions ranged from 20–100 pF and, because the value of Cm measured in an initial study of cells growing singly was 28.8 pF ± 5.2 pF (n= 10); this variability indicates that neighbouring cells can be electrically coupled to each other. There was, however, no obvious relationship between the magnitude of Cm and the number of cells in each group. Indeed, in many instances, we recorded low values of Cm from cells that were clearly in contact with their neighbours, and the extent to which the cells become electrically coupled to their neighbours therefore appears to be variable. Thus the currents reported in the present study flow across the membranes of one to five cells and larger values of Cm were associated with larger currents. To ensure that this variability did not contribute to the variability in the presented data, the magnitudes of all recorded currents have been normalized to Cm (i.e. expressed as pA/pF). For presentation, such data were scaled to the mean value of Cm associated a single cell, so that the presented data are shown as pA per average-sized cell. All potentials are corrected for the liquid junction potntial (−13 mV) between the bath and pipette solutions and cited values of membrane potential (Vm) were inferred from the value of VHold at which Im was zero. Data are presented as mean ± SEM and values of n denote the number of recordings made from different cells; all protocols were repeated in cells from at least three different passage numbers.
Phosphorylation of endogenous proteins
Cells on six-well plates were washed with ice-cold PBS and scraped into ice-cold lysis buffer containing protease and phosphatase inhibitors (1% Triton; 50 mM Tris – HCl, pH 7.5; 1 mM EGTA; 1 mM EDTA; 1 mM Na orthovanadate; 10 mM glycerol phosphate; 50 mM NaF; 5 mM Na pyrophosphate; 270 mM sucrose; 0.1% β-mercaptoethanol; 1 Roche Mini Protease Inhibitor tablet per 10 mL). Lysates were then transferred to Eppendorf tubes, ultrasonicated to ensure complete cellular disruption and their protein contents determined using Bradford reagent. Aliquots of extracted protein were reduced and denatured by heating (95°C, 5 min) in the presence of 5% β-mercapto-ethanol and 2% SDS and fractionated on SDS-polyacrylamide gels. Fractionated proteins were then transferred to Hybond-P membranes (GE Healthcare, Buckinghamshire, UK) that were probed using antibodies against the Thr346/356/366-phosphorylated and total forms of the protein encoded by the N-myc dowstream regulated gene 1 (NDRG1); the Ser473-phosphorylated, Thr308-phosphorylated and total forms of protein kinase B (PKB); the Thr389-phosphorylated and total forms of 70 kDa ribosomal S6 kinase (P70-S6K), and the Ser240-phosphorylated and total forms of the 40 kDa proline-rich substrate of Akt/PKB (PRAS40). The antibodies against NDRG1 and PRAS-40 were generously made available by Prof. Sir Philip Cohen (MRC-Protein Phosphorylation Unit, University of Dundee) and the antibodies against PKB and P70-S6K were from Cell Signalling (Hertfordshire, UK). Molecular weights of identified bands were estimated by comparing their electrophoretic mobilities with those of a series of protein standards.
Expression of ENaC subunits
Cells on six-well plates were placed on ice, extensively washed with ice-cold PBS and then exposed (1 h at 4°C with gentle agitation) to 10 mM sulfosuccinimidyl-2-(biotinamido)-ethyl-1,3′dithioproprionate (EZ-Link Sulfo-NHS-SS-Biotin, Pierce, Fisher Scientific, West Sussex, UK), a reagent that covalently modifies proteins by attaching a cleavable biotin moiety to amine groups in N-terminal amino acid residues and in lysine side chains. The biotinylation reaction was terminated with excess substrate (ice-cold 100 mM glycine) and the cells then lysed as described above. All lysates were centrifuged at 14 000 x g for 30 min to precipitate cell debris/insoluble proteins, and the protein content of the cleared samples determined using Bradford reagent (Bio-Rad, Hemel Hempstead, UK). Protein that had simply been extracted from the cells in this way is referred to as ‘total cellular protein’. In an initial series of experiments, aliquots (500 µg) of total protein were mixed with streptavidin-coated agarose beads (Pierce, Fisher Scientific) and allowed to equilibrate for 60 min at room temperature with continual agitation. Streptavidin binds biotin with high affinity and proteins that have been modified by exposure to the sulpho-NHS-SS-biotin reagent will thus bind to these beads. The beads were washed extensively to remove unbound proteins and then heated to 95°C under strongly reducing/denaturing conditions (5% β-mercapto-ethanol/2% SDS) in order to cleave the disulphide bonds in the biotin moiety and release bound proteins into solution. The protein purified in this way is referred to as ‘biotinylated protein’. Experiments (n= 8) in which the mass of biotinylated protein that could be purified using a relatively large volume (500 µL) of streptavidin-bead slurry was assayed using a protein assay compatible with reducing/denaturing agents (RC–DC reagent, Bio-Rad, Hemel Hempstead, UK), showed that 48.0 ± 0.7 µg of protein was recovered from an initial 500 µg aliquot. Because the protein-binding capacity of the streptavidin-coated beads is 1–3 mg·mL−1 per slurry, all subsequent experiments used 150 µL of slurry to isolate the biotinylated protein from 500 µg of total protein. Under these conditions, there is an approximate threefold excess binding capacity and the smaller bead volume allows the biotinylated proteins to be released directly into 50 µL of the sample buffer used for SDS-PAGE. Western analysis showed that β-actin was readily detectable in 1 µg aliquots of total protein and, although β-actin could also be detected in 20 µg aliquots of biotinylated protein, it was necessary to overexpose the blots in order to detect this protein. Because β-actin is a cytoskeletal protein that is confined to the inner leaflet of the plasma membrane, this protein would be inaccessible to biotinylation reagents in the extracellular fluid. The presence of β-actin in the biotinylated protein fraction thus shows that this protein pool does contain some intracellular proteins. However, densitometric analysis showed that the abundance of β-actin in a 20 µg aliquot of biotinylated protein was ∼30% of the abundance measured in 1 µg of total protein. This finding indicates that the surface biotinylation/streptavidin binding protocol allows surface-exposed proteins to be isolated with 98–99% purity, and this protein fraction is therefore referred to as the ‘surface protein’. In all subsequent experiments, aliquots of total protein (40 µg) and of the surface protein purified from 500 µg of total protein were subject to Western blot analysis using antibodies against α-, β- and γ-ENaC, and β-actin. The antibody against α-ENaC was a gift from Cystic Fibrosis Center, University of North Carolina (Chapel Hill, NC, USA); the antibody against β-ENaC was from Santa Cruz Biotechnology (Heidelberg, Germany), while the γ-ENaC and β-actin antibodies were from Sigma Chemical Co.
Data analysis and experimental design
The results of experiments that simply explored the effects of exposing cells to a single test substance were analysed using Student's t-test, while the data from experiments that followed more complex protocols were analysed using one-way anova with a Bonferroni post hoc test. Experiments were undertaken using strictly paired experimental designs in which the control and experimental cells were harvested from the same culture flasks and cultured in parallel. Care was taken to ensure that the control and experimental cells were subject to an identical series of solution changes, and none of the effects reported here can therefore be attributed to variations in physical disturbance. Protein samples from control and experimental cells were extracted and processed in parallel using identical reagents; fractionated on the same gels, and Western blots probed using identical antibodies and other reagents. For quantitative analysis, a computer scanner was used to produce image files of each blot, and a standard software package (ImageJ) was then used to quantify the optical density of the bands corresponding to control/experimental protein. Background subtraction was achieved by subtracting the optical density measured for an identically sized area of clear gel adjacent to the region of interest. In order to present the pooled results from a series of experiments, we first calculated the mean optical density for the control samples. All individual data points were then normalized to this mean value, and all such data are therefore presented as relative abundances. All presented images were processed digitally and, although minor adjustments were made to contrast/brightness, these changes were applied to the entire image. No specific feature visible in any image has therefore been enhanced, obscured, moved or introduced.
Materials
Amiloride, dexamethasone and rapamycin were from Sigma Chemical Co., Poole, Dorset; PI103 from Merck KGaA, Darmstadt, Germany and GSK650394 from TOCRIS Bioscience, Bristol, UK. TORIN1 was a kind gift from Prof David Sabatini (Whitehead Institute for Biomedical Research, Cambridge, Mass., USA).
Results
Dexamethasone-induced activation of ENaC
Analysis of the total membrane currents recorded from glucocorticoid-deprived cells showed that the relationship between Im and VHold was essentially linear at physiologically relevant values of VHold but displayed outward rectification at depolarized potentials (Figure 1A); Vm was normally ∼−45 mV (Figure 1A,C). Amiloride (10 µM) had no effect upon the total membrane current recorded from such cells and therefore caused no change in Vm (Figure 1A,C), and further analysis of these data thus showed that IAmil (see Methods) was negligible (Figure 1D). Studies of dexamethasone-treated (0.2 µM, ∼24 h) cells, on the other hand, revealed relatively depolarized values of Vm (Figure 1B,C) and these hormone-treated cells displayed hyperpolarizing responses to 10 µM amiloride (ΔVm∼−40 mV, Figure 1B); further analysis of these data revealed an amiloride-sensitive component to the total membrane current that reversed at a potential (∼65 mV) close to ENa (Figure 1D); this current (IAmil) is therefore Na+ selective.
Figure 1.
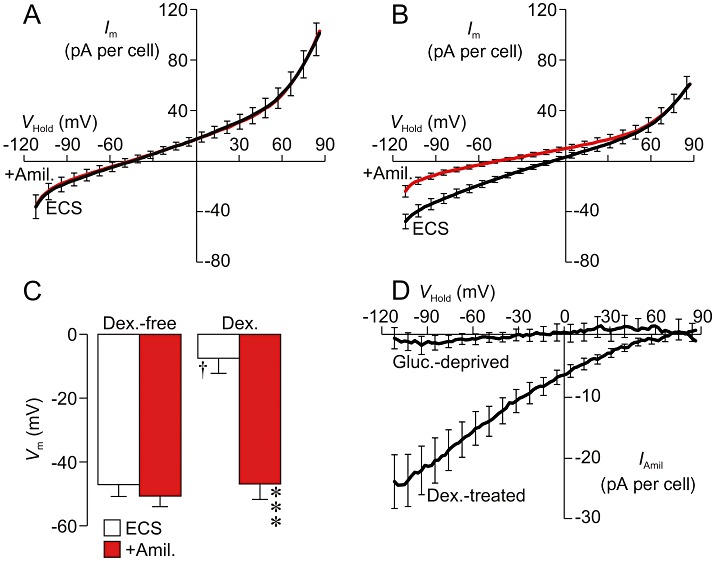
Prolonged (24 h) exposure to dexamethasone activates epithelial Na+ channels (ENaC). (A) Relationships (n= 12, Cm= 45.7 ± 5.2 pF; Ra= 22.2 ± 4.1 MΩ) between total membrane current (Im) and holding potential (VHold) quantified in glucocorticoid-deprived cells during exposure to the standard extracellular solution (ECS) and after 20–30 s exposure to 10 µM amiloride (+Amil.). (B) Equivalent data from dexamethasone-treated (0.2 µM, ∼24 h) cells (n= 9, Cm= 47.6 ± 8.0 pF; Ra= 28.9 ± 3.1 MΩ). (C) Values of membrane potential (Vm) derived by analysis of the data in A and B (means ± SEM). ***P < 0.001, significant effects of amiloride, Student's paired t–test. †P < 0.05, significant effect of dexamethasone, one-way anova with Bonferroni post hoc test. (D). The amiloride-sensitive component of the total membrane current (IAmil) was isolated by further analysis of the data in A (Gluc.-deprived) and B (Dex.-treated) and has been plotted against VHold.
Kinase inhibitors suppress the phosphorylation of endogenous protein substrates
Analysis of protein extracted from dexamethasone-treated (0.2 µM, 24 h) cells revealed clearly detectible levels of Ser473-phosphorylated (Figure 2A,B) and Thr308-phosphorylated (Figure 2C,D) PKB and, because these residues are physiological substrates for TORC2 and PDK1, respectively (Biondi et al., 2001; Bayascas and Alessi, 2005), this result shows that these PI3K-dependent protein kinases are active under these conditions. Such analyses also revealed phosphorylation of NDRG1-Thr346/356/366 (Figure 2E,F), PRAS40-Ser240 (not shown, n= 3) and P70-S6K-Thr389 (not shown, n= 3) and, since these residues are physiological substrates for SGK1, PKB and the target of rapamycin signalling complex 1 (TORC1), respectively (Kovacina et al., 2003; Murray et al., 2004; 2005; Proud, 2007), it is clear that these PI3K-dependent protein kinases are also active in dexamethasone-treated cells. PI103 (0.5 µM, 3 h) appeared to cause a marked reduction in the cellular abundance of Ser473-phosphorylated (Figure 2A) and Thr308-phosphorylated (Figure 2C) PKB, and densitometric/statistical analysis of the data from the entire series of such experiments confirmed that these effects were statistically significant (Figure 2B,D). Moreover, PI103 had no effect upon the overall PKB expression level (Figure 2B,D) and therefore causes virtually complete inactivation of TORC2 and PDK1. PI103 also caused a marked fall in the abundance of Thr346/356/366-phosphorylated NDRG1 without altering the overall NDRG1 expression level (Figure 2E,F), and it is therefore clear that this substance also inactivates SGK1. PI103 (0.5 µM, 3 h) similarly suppressed the phosphorylation of PRAS40-Ser240 (n= 3, not shown) demonstrating inactivation of PKB. Rapamycin (0.1 µM, 3 h), a highly selective inhibitor of TORC1 (Bain et al., 2007) did not alter the phosphorylation status of PKB-Ser473 (Figure 2A,B), PKB-Thr308 (Figure 2C,D) or NDRG1-Thr346/356/366 (Figure 2E,F) but did suppress the phosphorylation of P70-S6K-Thr389 (not shown, n= 3), a TORC1 substrate (Proud, 2007) indicating essentially inactivation of this protein kinase. GSK650394 (10 µM, 3 h) had no effect upon the phosphorylation of PKB-Ser473 (Figure 2A,B), PKB-Thr308 (Figure 2C,D) or PRAS40-Ser240 (n= 3, not shown) but did suppress the phosphorylation of NDRG1-Thr346/356/366 (Figure 2E,F) indicating selective inactivation of SGK1. TORIN1, a recently developed inhibitor of TORC1 and TORC2 (Thoreen et al., 2009), caused a concentration-dependent fall in the abundance of Ser473-phosphorylated PKB that occurred without influencing the overall PKB expression level, and this effect was complete at 0.1 µM (Figure 3A,B). While high concentration of TORIN1 also significantly suppressed the phosphorylation of PKB-Thr308, this effect (∼50% inhibition, Figure 3C,D) was smaller (P < 0.001, Student's t-test) than the effect on PKB-Ser473 (∼90% inhibition, Figure 3A,B), and statistical analysis of these data confirmed (P < 0.05) that TORIN1 inhibited the phosphorylation of PKB-Ser473 more effectively than it suppressed the phosphorylation of PKB-Thr308. TORIN1 (0.1 µM, 3 h) also virtually abolished the phosphorylation of NDRG1-Thr346/356/366 (Figure 3E,F) and, because rapamycin had no such effect (Figure 2E,F), this apparent inactivation of SGK1 must reflect inhibition of TORC2.
Figure 2.
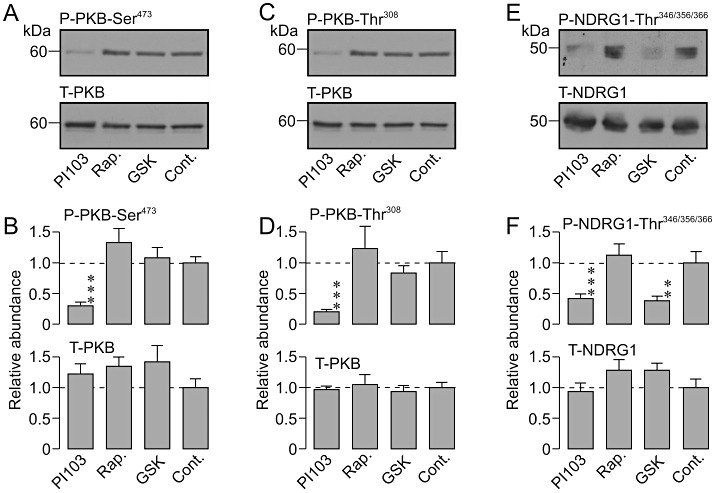
Phosphorylation status of endogenous kinase substrates. Control (Cont) cells were maintained in dexamethasone-containing (0.2 µM) medium for 24 h before being used in experiments while inhibitor-treated cells were exposed to 0.5 µM PI103 (PI103, n= 11), 0.1 µM rapamycin (Rap., n= 8) or 10 µM GSK650394 (GSK, n= 4) for the final 3 h of this incubation period. Aliquots of extracted protein (40 µg) were then subject to Western analysis using antibodies against (A, B) Ser473-phosphorylated/total protein kinase B (P-PKB-Ser473/T-PKB); (C, D) Thr308-phosphorylated/total PKB (P-PKB-Thr308/T-PKB), and (E, F) Thr346/356/366-phosphorylated/total n-myc downstream regulated gene 1 protein (P-NDRG1-Thr346/356/366/T-NDRG1). A, C and E each show representative blots from single experiments while B, D and F present the pooled data obtained by densitometric analysis of the entire series of experiments (means ± SEM). ***P < 0.01; **P < 0.02, significantly different from control, Student's paired t-test.
Figure 3.
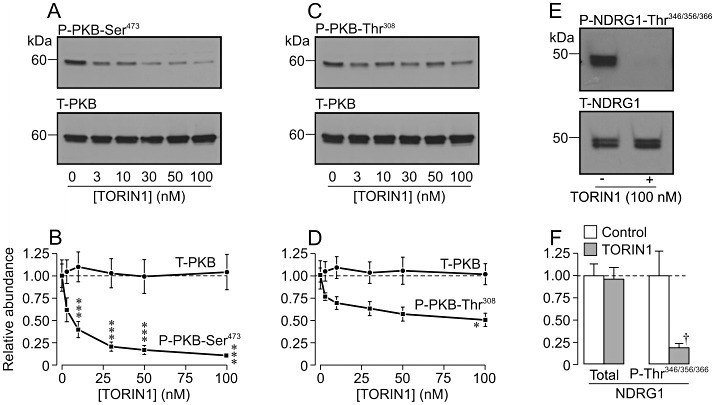
Effects of TORIN1. Dexamethasone-treated (0.2 µM, 24 h) cells were either maintained under control conditions or exposed to TORIN1 (3–100 nM) for the final 3 h of this incubation period. Aliquots of protein extracted from control and TORIN1-treated cells (n= 5 for each) were then analysed by Western blotting using antibodies against Ser473-phosphorylated/total protein kinase B (P-PKB-Ser473/T-PKB, A, B), Thr308-phosphorylated/total PKB (P-PKB-Thr308/T-PKB, C, D) and Thr346/356/366-phosphorylated/total protein encoded by n-myc downstream regulated gene 1 (P-NDRG1-Thr346/356/366/T-NDRG1, E, F). A, C and E show representative blots from single experiments while B, D and F show pooled data derived from densitometric analysis of the entire series of experiments (mean ± SEM). ***P < 0.01, **P < 0.05, one-way anova with Bonferroni post hoc test.; †P < 0.05, Student's paired t–test; significant effects of TORIN1.
Dexamethasone-induced Na+ currents are dependent on the PI3K–TORC2–SGK1 pathway
In a further series of electrophysiological studies, total membrane currents were again recorded from cells that had been exposed to 0.2 µM dexamethasone for ∼24 h (n= 5). Analysis of these data confirmed (see earlier) that such dexamethasone-treated cells display depolarized values of Vm (0.4 ± 8.1 mV), and analysis of the total membrane currents recorded after 10–30 s exposure to 10 µM amiloride showed that Vm had fallen to −67.1 ± 9.2 mV (P < 0.001). These data thus confirm that this ENaC blocker hyperpolarizes dexamethasone-stimulated cells and further analysis (Figure 4A) revealed an amiloride-sensitive component to the total membrane current essentially identical to that described earlier; the magnitude of the amiloride-sensitive current flowing at EK (IAmil(−82 mV)) was approximately −50 pA per cell (Figure 4E). Parallel experiments (n= 6) in which total membrane currents were recorded from dexamethasone-treated (0.2 µM, ∼24 h) cells that had been exposed to 0.5 µM PI103 for 3–4 h showed that this inhibitor of PI3K hyperpolarized Vm to −51.0 ± 6.0 mV (P < 0.001), and amiloride had no effect upon the currents recorded under these conditions and thus caused no change in Vm (ΔVm=−6.3 ± 3.6 mV). Further analysis showed that PI103 abolished the amiloride-sensitive Na+-current that is normally seen in dexamethasone-treated cells (Figure 4A,E). Exposing dexamethasone-treated cells to rapamycin (0.1 µM, 3–4 h), on the other hand, did not alter Vm (control: −3.9 ± 5.3 mV, n= 4; rapamycin: −9.8 ± 4.2 mV, n= 4); did not modify the response to amiloride (control: ΔVm=−62.9 ± 10.2 mV; rapamycin: ΔVm=−36.7 ± 17.4 mV), and did not suppress the amiloride-sensitive Na+ current (Figure 4B,E). TORIN1 (0.1 µM, 3–4 h) mimicked the effects of PI103 by hyperpolarizing Vm (control: 8.3 ± 8.7 mV, n= 4; TORIN1: −58.5 ± 9.0 mV, n= 4, P < 0.05), abolishing the hyperpolarizing response to amiloride (control: ΔVm=−67.6 ± 19.6 mV; TORIN1: ΔVm=−8.3 ± 7.8 mV, P < 0.05) and essentially abolishing dexamethasone-induced, amiloride-sensitive Na+ current (Figure 4C,E). Similarly, GSK650394 (10 µM, 3–4 h) also hyperpolarized Vm (control: −10.3 ± 6.2 mV, n= 5; GSK650394: −38.0 ± 3.1 mV, n= 4, P < 0.001); abolished the response to amiloride (control: ΔVm=−55.6 ± 12.2 mV; GSK650394: ΔVm=−1.6 ± 1.7 mV, P < 0.001) and abolished the dexamethasone-induced Na+ current (Figure 4D,E).
Figure 4.
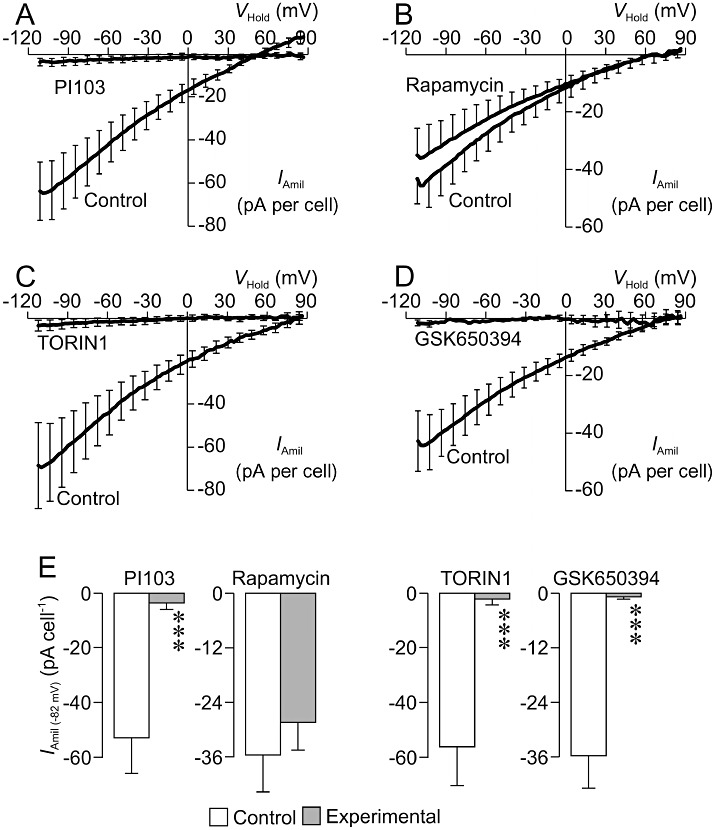
Dexamethasone-induced Na+ currents – effects of kinase inhibitors. Total membrane currents (Im) were recorded both under standard conditions and after 10–30 s exposure to 10 µM amiloride. The amiloride-sensitive component of the total membrane current (IAmil) was then isolated by digitally subtracting the current that persisted in the presence of amiloride from the corresponding record of control current, and plotted (mean ± SEM) against VHold. (A) Data from cells exposed to 0.2 µM dexamethasone for ∼24 h under control conditions, and from cells that had also been exposed to 0.5 µM PI103 for the final 3–4 h of this incubation period (control: n= 5, Cm= 55.3 ± 10.8 pF; Ra= 27.5 ± 11.9 MΩ; PI103-treated: n= 6, Cm= 46.2 ± 9.3 pF; Ra= 32.8 ± 8.4 MΩ). (B) Data from experiments that used an identical protocol to explore the effects of 0.1 µM rapamycin (3–4 h) upon IAmil in dexamethasone-treated (0.2 µM, ∼24 h) cells (control: n= 4, Cm= 67.4 ± 13.4 pF; Ra= 27.8 ± 10.8 MΩ; rapamycin-treated: n = 5, Cm= 79.3 ± 19.3 pF; Ra= 30.7 ± 4.1 MΩ). (C) Analogous data showing the effects of 0.1 µM TORIN1 (control: n= 4, Cm= 39.9 ± 10.1 pF; Ra= 20.1 ± 3.9 MΩ; TORIN1-treated: n= 4, Cm= 40.5 ± 5.8 pF; Ra= 33.1 ± 6.9 MΩ). (D) Analogous data showing the effects of 10 µM GSK650394 (control: n= 5, Cm= 69.7 ± 11.7 pF; Ra= 39.4 ± 10.1 MΩ; GSK650394-treated: n= 4, Cm= 35.4 ± 2.9 pF; Ra= 39.8 ± 11.8 MΩ). (E) Pooled data showing the amiloride-sensitive currents flowing at −82 mV (IAmil (−82 mV), mean ± SEM) quantified in control (i.e. 0.2 µM dexamethasone, ∼24 h) and inhibitor-treated (3–4 h) cells. ***P < 0.001, significantly different from appropriate control, Student's t-test.
Dexamethasone-induced ENaC expression
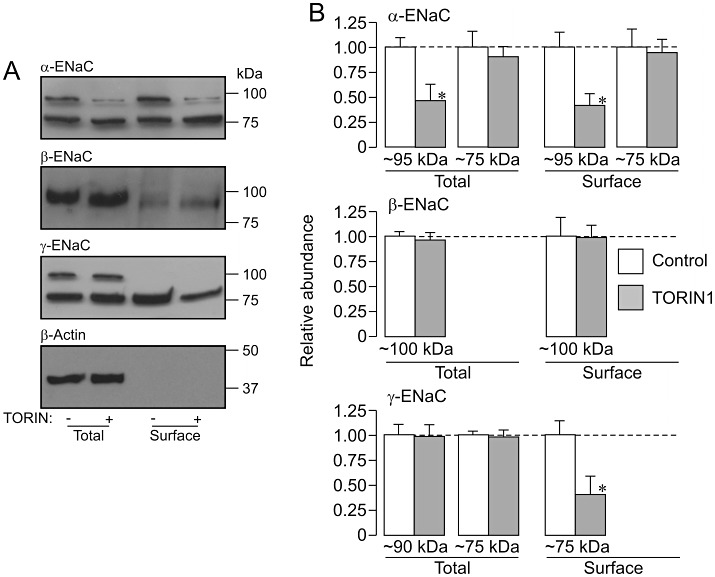
The α-ENaC antibody consistently detected two bands (∼95 and ∼75 kDa) in the total and the surface protein pools (see Methods) and a direct comparison of protein extracted from glucocorticoid-deprived and dexamethasone-stimulated cells (0.2 µM, 24 h) showed that this synthetic glucocorticoid increased the overall abundance of both forms of α-ENaC (Figure 5A,E). Dexamethasone also increased the surface abundance of both forms of α-ENaC, and these changes were similar in magnitude to the effects on overall expression (Figure 5A,E). The antibody against β-ENaC revealed a single band at ∼100 kDa that was present in both the total and the surface protein pools and, although dexamethasone (0.2 µM, 24 h) significantly increased the overall abundance of this protein, this synthetic glucocorticoid had no effect upon the surface abundance of β-ENaC (Figure 5B,F). The γ-ENaC antibody identified two bands (∼90 and ∼75 kDa) in total protein but only the ∼75 kDa form of γ-ENaC was present at the cell surface (Figure 5C,G). Although dexamethasone (0.2 µM, 24 h) had no discernible effect upon the pattern of γ-ENaC expression, it did cause a small but significant increase in the surface abundance of the 75 kDa form of γ-ENaC (Figure 5C,G).
Figure 5.
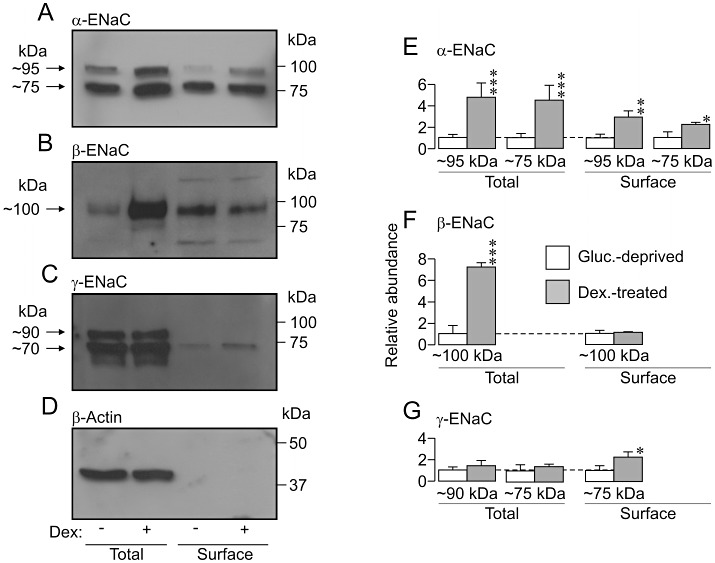
Effects of prolonged (∼24 h) exposure to 0.2 µM dexamethasone upon the expression of epithelial Na+ channel α, β and γ subunits (α-, β- and γ-ENaC). (A) Western blots showing the abundance of α-ENaC in aliquots of total (40 µg) and surface-exposed (purified from 500 µg of total protein) protein derived from glucocorticoid-deprived and dexamethasone-treated (0.2 µM, ∼24 h) cells. Analogous data for β- (B), γ-ENaC (C) and β-actin (D) are also presented. (E–G) Densitometric analyses showing the pooled results from five independent experiments. *P < 0.05; **P < 0.001; ***P < 0.005, significant effects of dexamethasone, Student's paired t-test.
Effects of kinase inhibitors on the expression of ENaC subunits in dexamethasone-stimulated cells
Figures 6–9 show the results of experiments that used a strictly paired experimental protocol to study the effects of protein kinase inhibitors (3 h) upon the pattern of α-, β- and γ-ENaC expression in dexamethasone-stimulated (0.2 µM, 24 h) cells. The control data in these figures confirm the pattern of expression described earlier. PI103 (0.5 µM, Figure 6), rapamycin (0.1 µM, Figure 7), TORIN1 (0.1 µM, Figure 8) and GSK650394 (10 µM, Figure 9) all reduced the overall abundance of the 95 kDa form of α-ENaC, and these effects were accompanied by corresponding reductions in the surface abundance of this channel subunit. However, these substances did not alter the abundance of the 75 kDa form of α-ENaC in the total or the surface-exposed protein pools (Figures 6–9). The kinase inhibitors also had no effect upon the abundance of β-ENaC in either the total or the surface-exposed protein pools and also failed to alter the overall abundance of γ-ENaC (Figures 6–9). However, PI103 (Figure 6), TORIN1 (Figure 8) and GSK650394 (Figure 9) all reduced the amount of the 75 kDa form of γ-ENaC that was present at the cell surface. Rapamycin, on the other hand, did not alter the pattern of γ-ENaC expression (Figure 7).
Figure 6.
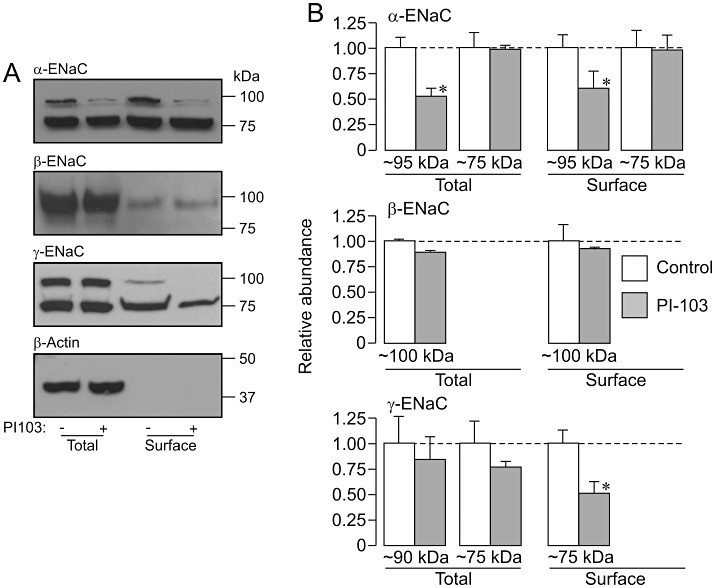
Effects of P1103 upon α-, β- and γ-ENaC expression in dexamethasone-treated cells. Total and surface-exposed proteins were extracted from dexamethasone-treated (0.2 µM, ∼24 h) cells that had either been maintained under control conditions or exposed to 0.5 µM PI103 for the final 3 h of the incubation period. The surface-exposed proteins purified from 500 µg aliquots of total protein were fractionated (SDS-PAGE) in parallel with 40 µg aliquots of total protein, and subject to Western analysis using antibodies against α-ENaC, β-ENaC, γ-ENaC and β-actin. (A) Western blot showing data from an individual experiment; bars to the right indicate the approximate position of the appropriate molecular weight markers. (B) Densitometric analysis showing the pooled data from four independent experiments (mean ± SEM). *P < 0.05, significant effects of PI103, Student's paired t-test.
Figure 9.
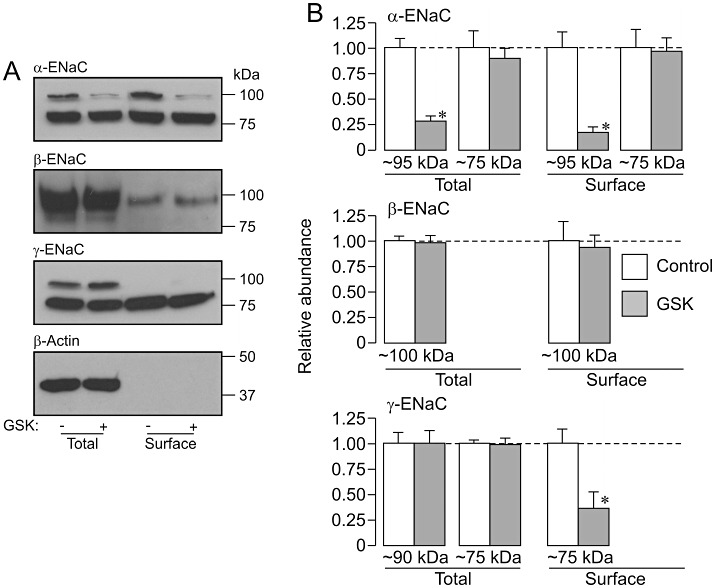
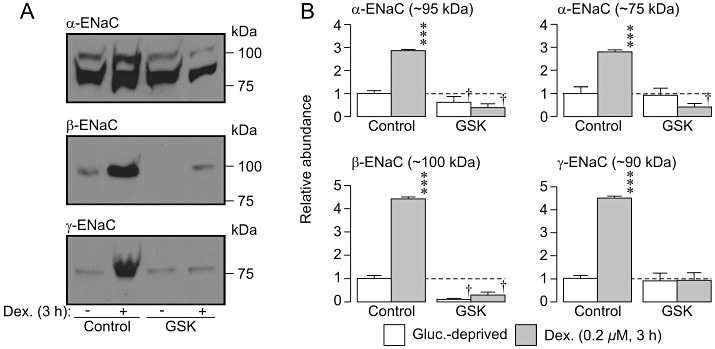
Effects of GSK650394 upon α-, β- and γ-ENaC expression in dexamethasone-treated (0.2 µM, ∼24 h) cells. Total and surface-exposed proteins were from dexamethasone-treated (0.2 µM, ∼24 h) control cells and from cells exposed to 10 µM GSK650394 for the final 3 h of the incubation period were analysed as described in Figure 5. (A) Western blot showing the results of an individual experiment; bars to the right indicate the approximate position of the appropriate molecular weight markers. (B) Densitometric analysis showing the pooled data from four independent experiments (mean ± SEM). *P < 0.05, significant effects of GSK650394, Student's paired t-test.
Figure 7.
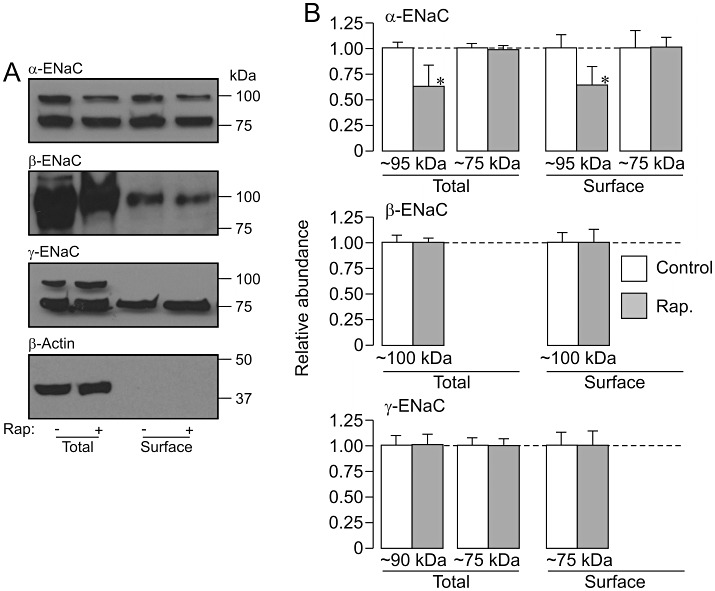
Effects of rapamycin upon α-, β- and γ-ENaC expression in dexamethasone-treated (0.2 µM, ∼24 h) cells. Total and surface-exposed proteins were extracted from dexamethasone-treated (0.2 µM, ∼24 h) control cells and from dexamethasone-treated cells that had been exposed to 0.1 µM rapamycin for the final 3 h of the incubation period, and analysed as described in Figure 5. (A) Western blot showing data from an individual experiment; bars to the right indicate the approximate position of the appropriate molecular weight markers. (B) Densitometric analysis showing the pooled data from four independent experiments (mean ± SEM). *P < 0.05, significant effects of rapamycin, Student's paired t-test.
Figure 8.
Effects of TORIN1 upon α-, β- and γ-ENaC expression in dexamethasone-treated (0.2 µM, ∼24 h) cells. Total and surface-exposed proteins were from dexamethasone-treated (0.2 µM, ∼24 h) control cells and from cells exposed to 0.1 µM TORIN1 for the final 3 h of the incubation period were analysed as described in Figure 5 (A) Western blot showing the results of an individual experiment; bars to the right indicate the approximate position of the appropriate molecular weight markers. (B) Densitometric analysis showing the pooled data from four independent experiments (mean ± sSEM). *P < 0.05, significant effects of TORIN1, Student's paired t-test.
Dexamethasone-induced activation of SGK1 is transient
The data in Figure 10A confirm (Inglis et al., 2009) that dexamethasone activates SGK1 (i.e. evokes phosphorylation of NDRG1-Thr346/356/366). This response became apparent after ∼30 min and persisted for at least 6 h (Figure 10A,B). Although SGK1 activity is dependent upon the TORC2-catalysed phosphorylation of SGK1-Ser422 (Kobayashi and Cohen, 1999; Park et al., 1999; García-Martínez and Alessi, 2008), these experiments also showed that dexamethasone (0.2 µM, 0–6 h) had no significant effect upon the phosphorylation of PKB-Ser473 (Figure 10C,D) an endogenous TORC2 substrate (Sarbassov et al., 2005). It is therefore clear that this synthetic glucocorticoid increases cellular SGK1 activity without activating the PI3K – TORC2 pathway. A further series of experiments confirmed that brief (3 h) exposure to dexamethasone (0.2 µM) activated SGK1 (Figure 10E,F) but not TORC2 (Figure 10G,H), but also showed that prolonged (24 h) exposure to dexamethasone had no effect upon the phosphorylation status of NDRG1-Thr346/356/366 (Figure 10E,F) or PKB-Ser473 (Figure 10G,H). Although dexamethasone clearly activates SGK1, the present data indicate that SGK1 activity returns to its basal level after 24 h of continuous stimulation.
Figure 10.
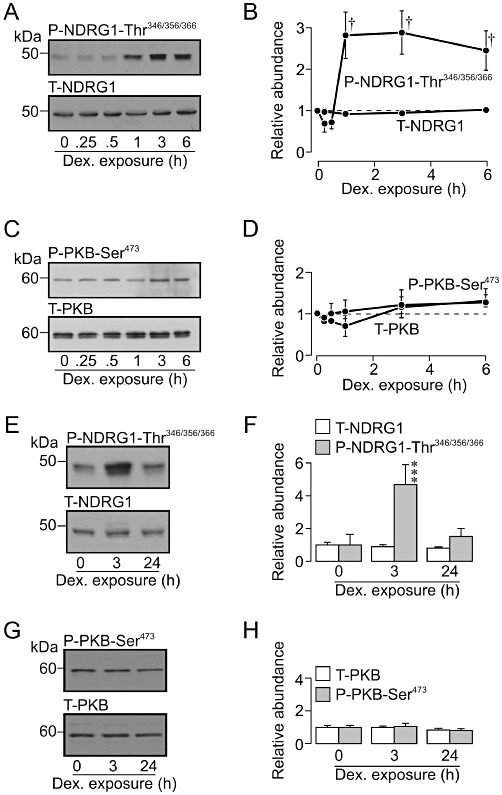
Dexamethasone causes only a transient increase in SGK1 activity. (A) Typical Western blots showing the effects of dexamethasone (0.2 µM, 0–6 h) upon the abundance of Thr346/356/366-phosphorylated (upper panel) and total (lower panel) n-myc downstream regulated gene 1 protein (NDRG1). (B) Densitometric analysis showing the pooled data from six such experiments. (C) Typical blots showing the results of experiments that used the same protocol to explore the effects of dexamethasone (0.2 µM, 0–6 h) upon the abundance of Ser473-phosphorylated (upper panel) and total (lower panel) PKB. (D) Densitometric analysis showing the pooled data from six such experiments. (E) Typical Western blots showing the effects of short (3h) and long-term (∼24 h) dexamethasone exposure (0.2 µM) upon the abundance of Thr346/356/366-phosphorylated and total NDRG1. (F) Densitometric analysis showing the pooled data from five such experiments. (G) Typical Western blots showing the effects of short- (3 h) and long-term (∼24 h) dexamethasone stimulation (0.2 µM) upon the abundance of Ser473-phosphorylated (upper panel) and total PKB (lower panel).; essentially identical data were obtained in four independent experiments. (H) Densitometric analysis showing the pooled data from five such experiments. All data are mean ± SEM. †P < 0.001, one-way anova with Bonferroni post hoc test; ***P < 0.001, Student's paired t-test, significant effects of dexamethasone.
Brief (3 h) exposure to dexamethasone
As the glucocorticoid-induced activation of SGK1 peaked at ∼3 h (Figure 10), we also explored the effects of such relatively brief stimulation with dexamethasone upon the surface abundance of α-, β- and γ-ENaC. Western blot analysis confirmed that β-actin was virtually undetectable (not shown, n= 4) in the surface-exposed proteins derived from 500 µg of total protein (see Methods), a result that confirms that the biotinylation/streptavidin-binding protocol allows this protein pool to be isolated with high purity. These studies also confirmed that α-ENaC (∼95 kDa and ∼75 kDa), β-ENaC (∼100 kDa) and γ-ENaC (∼75 kDa) are all present in the plasma membranes of glucocorticoid-deprived cells (Figure 11). More importantly, these experiments clearly showed that brief (i.e. 3 h) stimulation with dexamethasone caused an unambiguous increase in the surface abundance of each of these subunits (Figure 11). Moreover, this response was abolished by GSK650394 (10 µM), and it is therefore clear that brief (3 h) exposure to dexamethasone induces an SGK1-dependent increase in the surface abundance of α-, β- and γ-ENaC (Figure 11). This observation prompted a further series of electrophysiological studies that used a strictly paired experimental design to compare the effects of brief (3–4 h) and prolonged (∼24 h) exposure to dexamethasone (0.2 µM) upon the activity of ENaC. Analysis of the total membrane currents recorded from these cells confirmed that glucocorticoid-deprived cells (n= 3) displayed hyperpolarized values of Vm (−64.4 ± 4.2 mV) that were insensitive to 10 µM amiloride (ΔVm=−0.2 ± 1.5 mV), and IAmil was therefore negligible (Figure 12). Moreover, experiments undertaken using cells that had been exposed to dexamethasone for ∼3 h revealed essentially identical values of Vm (−60.8 ± 7.2 mV) and these cells, in common with the glucocorticoid-deprived cells, were insensitive to amiloride (ΔVm=−0.5 ± 0.7 mV) and did not display discernible Na+ currents (Figure 12). However, parallel studies of cells that had been stimulated with dexamethasone for ∼24 h revealed depolarized values of Vm (−7.9 ± 7.3 mV) that differed significantly from the values measured in glucocorticoid-deprived cells and in cells that had been exposed to dexamethasone for only 3 h (P < 0.05, one-way anova /Bonferroni post hoc test). Moreover, these cells displayed hyperpolarizing responses to 10 µM amiloride (ΔVm=−57.8 ± 0.7 mV, P < 0.005, Student's paired t-test) and further analysis (Figure 12) revealed amiloride-sensitive Na+ currents essentially identical to those described earlier.
Figure 11.
Brief (3 h) stimulation with dexamethasone increases the surface abundance of epithelial Na+ channel subunits (α-, β- and γ-ENaC). (A) Typical Western blots showing the effects of dexamethasone (0.2 µM, 3 h) upon the surface abundance of epithelial Na+ channel α, β and γ subunits (α-, β- and γ-ENaC) both under control conditions and in the presence of 10 µM GSK650394 (GSK). (B) Densitometric analysis of the data (mean ± SEM) from four independent experiments. ***P < 0.001, significant differences between glucocorticoid-deprived and dexamethasone-stimulated cells,; †P < 0.05 significant effects of GSK650394, one-way anova with Bonferroni post hoc test.
Figure 12.
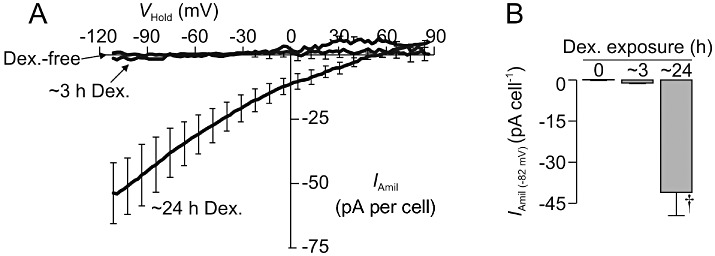
Effects of brief (∼3 h) and prolonged (∼24 h) stimulation of dexamethasone upon epithelial Na+ channel activity. (A) Relationships between amiloride-sensitive membrane current (IAmil, mean ± SEM) and holding potential (VHold) quantified in glucocorticoid-deprived cells (Dex.-free, n= 3, Cm= 47.7 ± 7.2 pF; Ra= 30.7 ± 9.1 MΩ) and in cells that had been exposed to 0.2 µM dexamethasone for ∼3h (∼3 h Dex., n= 5, Cm= 33.6 ± 2.3 pF; Ra= 30.7 ± 4.8 MΩ) or ∼24 h (∼24 h Dex., n= 5,Cm= 48.0 ± 3.0pF;Ra= 19.3 ± 2.1 MΩ). (B) Values of IAmil (−82 mV) derived by further analysis of these data. †P < 0.05, significantly different from corresponding values in glucocorticoid-free and in ∼3 h Dex.-treated cells, one-way anova with Bonferroni post hoc test.
Discussion
Dexamethasone depolarized H441 cells by activating an endogenous conductance essentially identical to that associated with co-expression of α-, β- and γ-ENaC and this observation confirms (see Lazrak and Matalon, 2003; Clunes et al., 2004; Brown et al., 2008; Althaus et al., 2010) that ENaC activity in these cells is strictly dependent upon glucocorticoid stimulation. Glucocorticoids are physiologically important regulators of pulmonary Na+ transport and, since these hormones stimulate the removal of fluid from the alveolar space (Matalon and O'Brodovich, 1999; Matthay et al., 2002; Olver et al., 2004), synthetic glucocorticoids are used in the clinical management of conditions such as neonatal respiratory distress syndrome and pulmonary oedema that are characterized by the accumulation of liquid in this region of the lung. Moreover, as glucocorticoids also exert powerful anti-inflammatory actions, glucocorticoid receptor agonists are also used in the treatment of lung diseases such as asthma and chronic obstructive pulmonary disease that are characterized by chronic inflammation (Barnes, 2011). It is therefore important to understand the mechanisms that allow pulmonary epithelial cells to respond to these hormones and, in order to study the mechanisms that underlie the activation of endogenous ENaC, we have now explored the effects of low MW inhibitors of various kinases upon the dexamethasone-dependent Na+ currents seen in these cells. However, this approach is complicated by the fact that such compounds almost invariably act upon multiple targets (Bain et al., 2007) and we therefore also used phospho-specific antibodies to monitor the phosphorylation status of endogenous kinase substrates in order to ensure that the tested compounds caused full inhibition of their targets without inactivating other, closely related kinases.
Effects of kinase inhibitors
Analysis of proteins extracted from dexamethasone-stimulated cells showed that PDK1 and TORC2 were both active and, since these kinases depend upon the presence of PIP2/3 in the plasma membrane (Biondi et al., 2001; Bayascas and Alessi, 2005; García-Martínez and Alessi, 2008), this result also suggests that PI3K is active under these conditions. These studies revealed the activity of SGK1 and PKB and this was anticipated because these regulatory kinases lie downstream of PI3K – TORC2/PDK1 (Kobayashi and Cohen, 1999; Park et al., 1999; Biondi et al., 2001; Bayascas and Alessi, 2005; Sarbassov et al., 2005; García-Martínez and Alessi, 2008). PI103 caused inactivation of PDK1, TORC2, SGK1 and PKB, and this broad action is consistent with selective inhibition of PI3K since the inactivation of this phospholipid kinase would deplete the membrane of PIP2/3 leading to inactivation of PDK1 and TORC2. This effect, in turn, would inactivate SGK1 and PKB (Kobayashi and Cohen, 1999; Park et al., 1999; Bayascas and Alessi, 2005; Sarbassov et al., 2005; García-Martínez and Alessi, 2008). Although PI103 is known to inhibit TORC1 as well as PI3K (Bain et al., 2007; Raynaud et al., 2007), this cannot explain the present data because rapamycin, a highly selective TORC1 inhibitor (Bain et al., 2007), did not mimic the effects of PI103 despite causing essentially complete inactivation of TORC1. Therefore, PI103 provides an effective means of inhibiting PI3K in H441 cells and the fact that PI103, but not rapamycin, abolished the dexamethasone-induced Na+ current shows that glucocorticoids control ENaC via a PI3K-dependent mechanism. This conclusion is consistent with previous studies (Blazer-Yost et al., 1998; 2003; Record et al., 1998; De La Rosa et al., 1999; 2003; Păunescu et al., 2000; Debonneville et al., 2001; Inglis et al., 2009).
In order to study the physiological basis of this requirement for PI3K our subsequent experiments explored the effects of TORIN1 a compound that inhibits TORC2, the protein kinase that allows PI3K to control both PKB and SGK1 (Sarbassov et al., 2005; García-Martínez and Alessi, 2008; Thoreen et al., 2009). When used at 0.1 µM, TORIN1 virtually abolished the phosphorylation of PKB-Ser473, indicating full inactivation of TORC2, but also suppressed the phosphorylation of PKB-Thr308, a PDK1 substrate (Bayascas and Alessi, 2005). While this effect might indicate direct inhibition of PI3K and/or PDK1, this is unlikely as these kinases are insensitive to TORIN1 at concentrations <1 µM (Thoreen et al., 2009). Moreover, the TORC2-catalysed phosphorylation of PKB-Ser473 is known to facilitate the subsequent phosphorylation of PKB-Thr308 by PDK1 and this interaction suggests that inhibition of TORC2 may also restrict the phosphorylation of PKB-Thr308 (Biondi et al., 2001; Sarbassov et al., 2005). Our data are consistent with earlier results that showed that TORIN1 (0.1 µM) inactivates TORC2 without inhibiting PI3K or PDK1 (Thoreen et al., 2009). The fact that TORIN1 also inactivated SGK1 therefore confirms that TORC2 is a critical part of the mechanism that allows PI3K to activate this protein kinase (Kobayashi and Cohen, 1999; Park et al., 1999; García-Martínez and Alessi, 2008; Lu et al., 2010). TORIN1 abolished glucocorticoid-induced ENaC activity as effectively as PI103 indicating that TORC2 is also important to the hormonal control of these channels (see also Lu et al., 2010; Mansley and Wilson, 2010a). Moreover, the fact that TORIN1 does not inhibit PI3K (Thoreen et al., 2009) predicts that PIP2/3 will be present in the membranes of TORIN1-treated cells and this is significant because these phospholipid second messengers can activate ENaC by binding directly to the channel complex (Blazer-Yost et al., 2004; Blazer-Yost and Nofziger, 2005; Ma et al., 2007; Pochynyuk et al., 2008). The fact that TORIN1 inactivates ENaC as effectively as PI103 thus implies that PIP2/3 cannot support ENaC activity if TORC2 is inactive and, while this does not exclude a role for PIP2/3 in the control of ENaC, this mechanism must be of secondary importance in H441 cells.
GSK650394 inactivated SGK1 without affecting PDK1, TORC2 or PKB and these data confirm that this compound is a selective inhibitor of SGK1 (Sherk et al., 2008; Mansley and Wilson, 2010a). The fact that GSK650394 also abolished dexamethasone-induced ENaC activity therefore shows that SGK1 is critical to the glucocorticoid-dependent control of these channels. It is particularly interesting that GSK650394 did not inhibit PKB since this protein kinase has been shown to activate ENaC expressed heterologously in Xenopus oocytes or Fisher rat thyroid cells, and it has been suggested that PKB might be involved in the hormonal control of Na+ transport via ENaC (Lee et al., 2007; Diakov et al., 2010). Although the present data do not exclude this possibility, they show that PKB cannot maintain ENaC activity independently of SGK1 in dexamethasone-stimulated H441 cells.
Glucocorticoid-induced changes in ENaC expression
Detectable levels of α-, β- and γ-ENaC were present in total protein from glucocorticoid-deprived cells and the fact these cells do not display amiloride-sensitive currents (present study, Clunes et al., 2004; Brown et al., 2008; Althaus et al., 2010) cannot, therefore, be attributed to the absence of ENaC. Dexamethasone (24 h) increased the overall expression of α- and β-ENaC, but not γ-ENaC, and this accords with earlier work that has shown that this synthetic glucocorticoid increases the abundance of mRNA encoding α- and β-ENaC in H441 cells (Ramminger et al., 2004; Thomas et al., 2004). Glucocorticoids can therefore control the expression of α- and β-ENaC and, while the mechanism underlying the regulated expression of β-ENaC is unclear, the effect on α-ENaC seems to be mediated by glucocorticoid-response elements in the α-ENaC gene promoter (see Itani et al., 2002; Thomas and Itani, 2004; McTavish et al., 2009).
While the β-ENaC antibody recognized only a single band, α- and γ-ENaC antibodies each identified two bands in total protein derived from glucocorticoid-deprived and dexamethasone-stimulated cells. This observation is consistent with reports that the post translational processing of α- and γ-ENaC, but not β-ENaC, involves cleavage by intracellular and extracellular proteases (see Vallet et al., 1997; Vuagniaux et al., 2002; Hughey et al., 2003; 2004; Caldwell et al., 2004; 2005; Myerburg et al., 2006; 2010; Diakov et al., 2008; Passero et al., 2008; Rossier and Stutts, 2009; Tan et al., 2011). Since these proteases act at different sites, the processing of these channel subunits generates a complex population of proteolytic fragments. The antibodies used in the present study were all directed against N-terminal sequences and molecular weights, which we now report are broadly consistent with the pattern of α- and γ-ENaC cleavage described by Rossier and Stutts, (2009). Although it has been suggested that the cleavage of α- and γ-ENaC is critical for the formation of active channels, we were unable to detect any effect of dexmethasone that was consistent with increased cleavage of these subunits despite the fact that this hormone clearly induced an amiloride-sensitive Na+ current. However, the data supporting this model are almost entirely derived from studies of heterologously expressed ENaC subunits incorporating synthetic epitopes (e.g. FLAG) that facilitate the identification of cleavage products. While proteases and protease inhibitors clearly modify electrogenic Na+ transport in absorptive cells and tissues (see, e.g. Myerburg et al., 2006; Lazrak et al., 2009; Tan et al., 2011), few authors have attempted to correlate ENaC activity with changes to the cleavage of endogenous subunits. It is possible that proteolytically cleaved forms of endogenous ENaC are present at a level too low to be detected by conventional methods (Myerburg et al., 2010).
Analysis of surface-exposed proteins showed that α-, β- and γ-ENaC were all present in the membranes of glucocorticoid-deprived and dexamethasone-stimulated cells and, while both forms of α-ENaC were detected, only the lighter form of γ-ENaC was present in this protein pool. Under our experimental conditions the 90 kDa form of γ-ENaC, which may correspond to the full length protein (Rossier and Stutts, 2009), appears to be confined to the intracellular compartment. Although dexamethasone (∼24 h) increased the surface expression of α-ENaC, this effect was of similar magnitude to the increase in overall expression. Moreover, prolonged (24 h) exposure to dexamethasone had no effect upon the surface abundance of β-ENaC, and caused only a modest increase in the surface expression of NaC. The present data do not, therefore, support the hypothesis that glucocorticoid-induced (∼24 h) epithelial Na+ currents are due to coordinated increases in the surface abundance of α-, β- and γ-ENaC (Blazer-Yost et al., 1998; 2003; Record et al., 1998; De La Rosa et al., 1999; 2003; Păunescu et al., 2000; Debonneville et al., 2001).
Exposing dexamethasone-treated (24 h) cells to PI103, TORIN1 and GSK650394 reduced the surface abundance of γ-ENaC and, because this action was not mimicked by rapamycin, the dexamethasone-induced increase in the surface expression of this subunit seems to be dependent upon the PI3K – TORC2 – SGK1 pathway. This accords well with earlier work (Blazer-Yost et al., 1998; 2003; Record et al., 1998; De La Rosa et al., 1999; 2003; Păunescu et al., 2000; Debonneville et al., 2001). However, PI103, TORIN1 or GSK650394 also reduced the amount of the 95 kDa form of α-ENaC that was present in the total and surface-exposed protein pools suggesting that the PI3K–TORC2–SGK1 pathway is involved in the control of α-ENaC synthesis (Boyd & Náray-Fejes-Tóth, 2005; Zhang et al., 2007; Reisenauer et al., 2009). However, most of these compounds also inhibit TORC1 and it is therefore interesting that rapamycin, a selective TORC1 inhibitor (Bain et al., 2007), also reduced the abundance of α-ENaC (95 kDa). It is possible that TORC1 may also contribute to the control of α-ENaC expression and, in this context, it is relevant that rapamycin has also been shown to disrupt the dexamethasone-induced activation of ENaC in renal epithelia (Mansley and Wilson, 2010a). However, none of the compounds tested in the present study had a discernible effect upon the expression of the 75 kDa form of α-ENaC, and the present data also show that rapamycin-induced inhibition of TORC1 did not suppress ENaC activity in H441 cells. The physiological significance of the effects on the 95 kDa form of α-ENaC is therefore not clear.
Brief (3 h) stimulation with dexamethasone
Although dexamethasone clearly activated SGK1, this response was not associated with any change to the activity of TORC2, and the situation seen in H441 cells is therefore similar to that documented for renal epithelia where the dexamethasone-induced activation of SGK1 seems to reflect de novo synthesis of SGK1 protein (Wang et al., 2001; Gonzalez-Rodriguez et al., 2007). However, as the nascent protein is catalytically inactive, the PI3K–TORC2 pathway is needed to phosphorylate SGK1-Ser422 and confer catalytic activity upon the newly synthesized protein (Kobayashi and Cohen, 1999; Park et al., 1999; García-Martínez and Alessi, 2008; Lu et al., 2010).
While undertaking these studies we noted glucocorticoid-deprived and dexamethasone-stimulated (24 h) cells often appeared to display very similar levels of NDRG1-Thr346/356/366 phosphorylation, and this observation (see also Inglis et al., 2009) prompted us to compare the effects of brief (3 h) and prolonged (24 h) dexamethasone stimulation upon the phosphorylation of these residues. These studies confirmed that brief exposure to dexamethasone did increase SGK1 activity without altering the activity of TORC2, but also showed that prolonged (24 h) stimulation had no apparent effect upon the activity of either kinase. Despite the sustained activation of ENaC, the present data therefore suggest that SGK1 activity returns to its basal level after ∼24 h continuous exposure to dexamethasone. Moreover, experiments that explored the effects of brief (3 h) exposure to dexamethasone upon the surface abundance of ENaC subunits showed that the period of increased SGK1 activity was associated with an unambiguous increase in the surface abundance of α-, β- and γ-ENaC. Furthermore, this response was abolished by GSK650394 and it is therefore clear that SGK1 does provide a mechanism that allows hormonal control over the surface expression of ENaC subunits. However, despite this clear finding, electrophysiological studies showed that brief (3 h) exposure to dexamethasone did not induce Na+ currents while studies of cells exposed to dexamethasone for ∼24 h confirmed the sustained activation of endogenous ENaC as described earlier.
Significance of present findings
The conceptual model almost invariably used to explain the role of SGK1 in the control of epithelial Na+ absorption (Blazer-Yost et al., 1998; 2003; Record et al., 1998; De La Rosa et al., 1999; 2003; Păunescu et al., 2000; Debonneville et al., 2001) predicts (i) that glucocorticoid-induced Na+ currents will depend upon SGK1; and (ii) that the magnitude of this Na+ current will correlate with the activity of SGK1 and with the abundance of ENaC subunits at the cell surface. Although data from the present study clearly verifies the first of these statements, they also show that the effects of dexamethasone upon SGK1 activity and the surface expression of ENaC subunits are transient and it is therefore clear that the sustained, SGK1-dependent activation of ENaC seen in glucocorticoid-stimulated H441 cells (present study Clunes et al., 2004; Brown et al., 2008; Althaus et al., 2010) cannot be attributed to SGK1-dependent changes to the surface abundance of ENaC subunits. Studies of heterologously expressed ENaC have suggested that SGK1 can control membrane Na+ current via a mechanism that does not appear to involve the recruitment of additional channel subunits to the membrane, and this response is dependent upon an SGK1-consensus motif in the C-terminal region of α-ENaC. It has been suggested that SGK1 may contribute to the control of ENaC activity by directly phosphorylating α-ENaC (Diakov and Korbmacher, 2004). However, this mechanism is unlikely to explain the sustained activation of ENaC reported here because our data indicate that glucocorticoid-induced SGK1 activity is not sustained.
The signalling pathways that allow glucocorticoids to evoke responses in pulmonary epithelia are complex (Barnes, 2011) and the present data show that the mechanisms that allow these hormones to evoke sustained activation of ENaC are not understood fully. Clarifying the mechanisms underlying this control over membrane Na+ conductance may facilitate the developments of novel therapies for respiratory distress and pulmonary oedema.
Acknowledgments
The authors thank the Wellcome Trust for their financial support. G.B.W. is grateful to the George John and Sheila Livanos Charitable Trust for a prize PhD studentship and N.A.S.I. thanks the Government of Malaysia for a Post Graduate studentship. We also thank Philip Cohen, Dario Alessi (College of Life Sciences, University of Dundee) and David Sabatini (Whitehead Institute for Biomedical Research, Cambridge, MA, USA) for the provision of reagents and valuable advice concerning their use.
Glossary
- ENaC
epithelial sodium channel
- IAmil
amiloride-sensitive component of the total membrane current
- IAmil (−82 mV)
amiloride-sensitive membrane current flowing at −82 mV
- Im
total membrane current
- Nedd-4/2
neural precursor cell expressed, developmentally down-regulated protein 4-2
- NDRG1
protein encoded by n-myc downstream regulated gene 1
- P70-S6K
70 kDa ribosomal S6 kinase
- PDK1
3-phosphoinositide-dependent protein kinase 1
- PIP2
phosphatidylinostiol 4,5-bisphosphate
- PIP3
phosphatidylinositol 3,4,5-trisphosphate
- PKB
protein kinase B (also known as Akt)
- PRAS40
40 kDa proline-rich substrate of Akt (PKB)
- SGK1
serum and glucocorticoid-inducible kinase 1
- TORC1 and 2
target of rapamycin complex 1 and 2
- VHold
holding potential
- Vm
membrane potential
Conflict of interest
The authors report no conflict of interest.
References
- Alexander SPH, Mathie A, Peters JA. Guide to Receptors and Channels (GRAC), 5th Edition. Br J Pharmacol. 2011;164(Suppl. 1):S1–S324. doi: 10.1111/j.1476-5381.2011.01649_1.x. [DOI] [PMC free article] [PubMed] [Google Scholar]
- Althaus M, Pichl A, Clauss WG, Seeger W, Fronius M, Morty RE. Nitric oxide inhibits highly selective sodium channels and the Na+/K+-ATPase in H441 cells. Am J Respir Cell Mol Biol. 2010;44:53–65. doi: 10.1165/2009-0335OC. [DOI] [PubMed] [Google Scholar]
- Bain J, Plater L, Elliott M, Shpiro N, Hastie CJ, McLauchlan H, et al. The selectivity of protein kinase inhibitors: a further update. Biochem J. 2007;408:297–315. doi: 10.1042/BJ20070797. [DOI] [PMC free article] [PubMed] [Google Scholar]
- Barnes PJ. Glucocorticosteroids: current and future directions. Br J Pharmacol. 2011;163:29–43. doi: 10.1111/j.1476-5381.2010.01199.x. [DOI] [PMC free article] [PubMed] [Google Scholar]
- Bayascas JR, Alessi DR. Regulation of Akt/PKB Ser473 phosphorylation. Mol Cell. 2005;18:143–145. doi: 10.1016/j.molcel.2005.03.020. [DOI] [PubMed] [Google Scholar]
- Biondi RM, Kieloch A, Currie RA, Deak M, Alessi DR. The PIF-binding pocket in PDK1 is essential for activation of S6K and SGK, but not PKB. EMBO J. 2001;20:4380–4390. doi: 10.1093/emboj/20.16.4380. [DOI] [PMC free article] [PubMed] [Google Scholar]
- Blazer-Yost BL, Nofziger C. Phosphoinositide lipid second messengers: new paradigms for transepithelial signal transduction. Pflugers Arch. 2005;450:75–82. doi: 10.1007/s00424-004-1371-5. [DOI] [PubMed] [Google Scholar]
- Blazer-Yost BL, Liu X, Helman SI. Hormonal regulation of ENaCs: insulin and aldosterone. Am J Physiol Cell Physiol. 1998;274:C1373–C1379. doi: 10.1152/ajpcell.1998.274.5.C1373. [DOI] [PubMed] [Google Scholar]
- Blazer-Yost BL, Esterman MA, Vlahos CJ. Insulin-stimulated trafficking of ENaC in renal cells requires PI 3-kinase activity. Am J Physiol Cell Physiol. 2003;284:C1645–C1653. doi: 10.1152/ajpcell.00372.2002. [DOI] [PubMed] [Google Scholar]
- Blazer-Yost BL, Vahle JC, Byars JM, Bacallao RL. Real-time three-dimensional imaging of lipid signal transduction: apical membrane insertion of epithelial Na+ channels. Am J Physiol Cell Physiol. 2004;287:C1569–C1576. doi: 10.1152/ajpcell.00226.2004. [DOI] [PubMed] [Google Scholar]
- Boucher RC. Airway surface dehydration in cystic fibrosis: pathogenesis and therapy. Annu Rev Med. 2007;58:157–170. doi: 10.1146/annurev.med.58.071905.105316. [DOI] [PubMed] [Google Scholar]
- Boyd C, Náray-Fejes-Tóth A. Gene regulation of ENaC subunits by serum- and glucocorticoid-inducible kinase-1. Am J Physiol Renal Physiol. 2005;288:F505–F512. doi: 10.1152/ajprenal.00242.2004. [DOI] [PubMed] [Google Scholar]
- Brown SG, Gallacher M, Olver RE, Wilson SM. The regulation of selective and nonselective Na+ conductances in H441 human airway epithelial cells. Am J Physiol Lung Cell Mol Physiol. 2008;294:L942–L954. doi: 10.1152/ajplung.00240.2007. [DOI] [PubMed] [Google Scholar]
- Caldwell RA, Boucher RC, Stutts MJ. Serine protease activation of near-silent epithelial Na+ channels. Am J Physiol Cell Physiol. 2004;286:C190–C194. doi: 10.1152/ajpcell.00342.2003. [DOI] [PubMed] [Google Scholar]
- Caldwell RA, Boucher RC, Stutts MJ. Neutrophil elastase activates near-silent epithelial Na+ channels and increases airway epithelial Na+ transport. Am J Physiol Lung Cell Mol Physiol. 2005;288:L813–L819. doi: 10.1152/ajplung.00435.2004. [DOI] [PubMed] [Google Scholar]
- Canessa CM, Horisberger JD, Rossier BC. Epithelial sodium channel related to proteins involved in neurodegeneration. Nature. 1993;361:467–470. doi: 10.1038/361467a0. [DOI] [PubMed] [Google Scholar]
- Canessa CM, Schild L, Buell G, Thorens B, Gautschi I, Horisberger JD, et al. Amiloride-sensitive epithelial Na+ channel is made of three homologous subunits. Nature. 1994;367:463–467. doi: 10.1038/367463a0. [DOI] [PubMed] [Google Scholar]
- Clunes MT, Butt AG, Wilson SM. A glucocorticoid-induced Na+ conductance in human airway epithelial cells identified by perforated patch recording. J Physiol. 2004;557:809–819. doi: 10.1113/jphysiol.2004.061143. [DOI] [PMC free article] [PubMed] [Google Scholar]
- De La Rosa AD, Zhang P, Náray-Fejes-Tóth A, Fejes-Tóth G, Canessa CM. The serum and glucocorticoid kinase (sgk) increases the abundance of epithelial sodium channels in the plasma membrane of Xenopus oocytes. J Biol Chem. 1999;274:37834–37839. doi: 10.1074/jbc.274.53.37834. [DOI] [PubMed] [Google Scholar]
- De La Rosa AD, Coric T, Todorovic N, Shao D, Wang T, Canessa CM. Distribution and regulation of expression of serum- and glucocorticoid-induced kinase-1 in the rat kidney. J Physiol. 2003;551:455–466. doi: 10.1113/jphysiol.2003.042903. [DOI] [PMC free article] [PubMed] [Google Scholar]
- Debonneville C, Flores SY, Kamynina E, Plant PJ, Tauxe C, Thomas MA, et al. Phosphorylation of Nedd4-2 by Sgk1 regulates epithelial Na+ channel cell surface expression. EMBO J. 2001;20:7052–7059. doi: 10.1093/emboj/20.24.7052. [DOI] [PMC free article] [PubMed] [Google Scholar]
- Diakov A, Korbmacher C. A novel pathway of epithelial sodium channel activation involves a serum- and glucocorticoid-inducible kinase consensus motif in the C terminus of the channel's α-subunit. J Biol Chem. 2004;279:38134–38142. doi: 10.1074/jbc.M403260200. [DOI] [PubMed] [Google Scholar]
- Diakov A, Bera K, Mokrushina M, Krueger B, Korbmacher C. Cleavage in the γ-subunit of the epithelial sodium channel (ENaC) plays an important role in the proteolytic activation of near-silent channels. J Physiol. 2008;586:4587–4608. doi: 10.1113/jphysiol.2008.154435. [DOI] [PMC free article] [PubMed] [Google Scholar]
- Diakov A, Nesterov V, Mokrushina M, Rauh R, Korbmacher C. Protein kinase B alpha (PKB alpha) stimulates the epithelial sodium channel (ENaC) heterologously expressed in Xenopus laevis oocytes by two distinct mechanisms. Cell Physiol Biochem. 2010;26:913–924. doi: 10.1159/000324000. [DOI] [PubMed] [Google Scholar]
- Fejes-Toth G, Frindt G, Naray-Fejes-Toth A, Palmer LG. Epithelial Na+ channel activation and processing in mice lacking SGK1. Am J Physiol Renal Physiol. 2008;294:F1298–F1305. doi: 10.1152/ajprenal.00579.2007. [DOI] [PubMed] [Google Scholar]
- García-Martínez JM, Alessi DR. mTOR complex 2 (mTORC2) controls hydrophobic motif phosphorylation and activation of serum- and glucocorticoid-induced protein kinase 1 (SGK1) Biochem J. 2008;416:375–385. doi: 10.1042/BJ20081668. [DOI] [PubMed] [Google Scholar]
- Gonzalez-Rodriguez E, Gaeggeler HP, Rossier BC. IGF-1 vs insulin: respective roles in modulating sodium transport via the PI-3 kinase/Sgk1 pathway in a cortical collecting duct cell line. Kidney Int. 2007;71:116–125. doi: 10.1038/sj.ki.5002018. [DOI] [PubMed] [Google Scholar]
- Horn R, Marty A. Muscarinic activation of ionic currents measured by a new whole-cell recording method. J Gen Physiol. 1988;92:145–159. doi: 10.1085/jgp.92.2.145. [DOI] [PMC free article] [PubMed] [Google Scholar]
- Hughey RP, Mueller GM, Bruns JB, Kinlough CL, Poland PA, Harkleroad KL, et al. Maturation of the epithelial Na+ channel involves proteolytic processing of the α- and γ-subunits. J Biol Chem. 2003;278:37073–37082. doi: 10.1074/jbc.M307003200. [DOI] [PubMed] [Google Scholar]
- Hughey RP, Bruns JB, Kinlough CL, Harkleroad KL, Tong QS, Carattino MD, et al. Epithelial sodium channels are activated by furin-dependent proteolysis. J Biol Chem. 2004;279:18111–18114. doi: 10.1074/jbc.C400080200. [DOI] [PubMed] [Google Scholar]
- Inglis SK, Gallacher M, Brown SG, McTavish N, Getty J, Husband EM, et al. SGK1 activity in Na+ absorbing airway epithelial cells monitored by assaying NDRG1-Thr346/356/366 phosphorylation. Pflugers Arch. 2009;457:1287–1301. doi: 10.1007/s00424-008-0587-1. [DOI] [PubMed] [Google Scholar]
- Itani OA, Liu KZ, Cornish KL, Campbell JR, Thomas CP. Glucocorticoids stimulate human sgk1 gene expression by activation of a GRE in its 5′-flanking region. Am J Physiol Endocrinol Metab. 2002;283:E971–E979. doi: 10.1152/ajpendo.00021.2002. [DOI] [PubMed] [Google Scholar]
- Knowles MR, Boucher RC. Mucus clearance as a primary innate defense mechanism for mammalian airways. J Clin Invest. 2002;109:571–577. doi: 10.1172/JCI15217. [DOI] [PMC free article] [PubMed] [Google Scholar]
- Kobayashi T, Cohen P. Activation of serum- and glucocorticoid-regulated protein kinase by agonists that activate phosphatidylinositide 3-kinase is mediated by 3-phosphoinositide-dependent protein kinase-1 (PDK1) and PDK2. Biochem J. 1999;339:319–328. [PMC free article] [PubMed] [Google Scholar]
- Kovacina KS, Park GY, Bae SS, Guzzetta AW, Schaefer E, Birnbaum MJ, et al. Identification of a proline-rich Akt substrate as a 14-3-3 binding partner. J Biol Chem. 2003;278:10189–10194. doi: 10.1074/jbc.M210837200. [DOI] [PubMed] [Google Scholar]
- Lang F, Artunc F, Vallon V. The physiological impact of the serum and glucocorticoid-inducible kinase SGK1. Curr Opin Nephrol Hypertens. 2009;18:439–448. doi: 10.1097/MNH.0b013e32832f125e. [DOI] [PMC free article] [PubMed] [Google Scholar]
- Lazrak A, Matalon S. cAMP-induced changes of apical membrane potentials of confluent H441 monolayers. Am J Physiol Lung Cell Mol Physiol. 2003;285:L443–L450. doi: 10.1152/ajplung.00412.2002. [DOI] [PubMed] [Google Scholar]
- Lazrak A, Nita I, Subramaniyam D, Wei SP, Song WF, Ji HL, et al. Alpha(1)-antitrypsin inhibits epithelial Na+ transport in vitro and in vivo. Am J Respir Cell Mol Biol. 2009;41:261–270. doi: 10.1165/rcmb.2008-0384OC. [DOI] [PMC free article] [PubMed] [Google Scholar]
- Lee IH, Dinudom A, Sanchez-Perez A, Kumar S, Cook DI. Akt mediates the effect of insulin on epithelial sodium channels by inhibiting Nedd4-2. J Biol Chem. 2007;282:29866–29873. doi: 10.1074/jbc.M701923200. [DOI] [PubMed] [Google Scholar]
- Loffing J, Korbmacher C. Regulated sodium transport in the renal connecting tubule (CNT) via the epithelial sodium channel (ENaC) Pflugers Arch. 2009;458:111–135. doi: 10.1007/s00424-009-0656-0. [DOI] [PubMed] [Google Scholar]
- Lu M, Wang J, Jones KT, Ives HE, Feldman ME, Yao LJ, et al. mTOR complex-2 activates ENaC by phosphorylating SGK1. J Am Soc Nephrol. 2010;21:811–818. doi: 10.1681/ASN.2009111168. [DOI] [PMC free article] [PubMed] [Google Scholar]
- Ma HP, Chou CF, Wei SP, Eaton DC. Regulation of the epithelial sodium channel by phosphatidylinositides: experiments, implications, and speculations. Pflugers Arch. 2007;455:169–180. doi: 10.1007/s00424-007-0294-3. [DOI] [PubMed] [Google Scholar]
- Mansley MK, Wilson SM. Dysregulation of epithelial Na+ absorption induced by inhibition of the kinases TORC1 and TORC2. Br J Pharmacol. 2010a;161:1778–1792. doi: 10.1111/j.1476-5381.2010.01003.x. [DOI] [PMC free article] [PubMed] [Google Scholar]
- Mansley MK, Wilson SM. Effects of nominally selective inhibitors of the kinases PI3K, SGK1 and PKB on the insulin-dependent control of epithelial Na+ absorption. Br J Pharmacol. 2010b;161:571–588. doi: 10.1111/j.1476-5381.2010.00898.x. [DOI] [PMC free article] [PubMed] [Google Scholar]
- Matalon S, O'Brodovich H. Sodium channels in alveolar epithelial cells: molecular characterization, biophysical properties, and physiological significance. Annu Rev Physiol. 1999;61:627–661. doi: 10.1146/annurev.physiol.61.1.627. [DOI] [PubMed] [Google Scholar]
- Matthay MA, Folkesson HG, Clerici C. Lung epithelial fluid transport and the resolution of pulmonary edema. Physiol Rev. 2002;82:569–600. doi: 10.1152/physrev.00003.2002. [DOI] [PubMed] [Google Scholar]
- McTavish N, Getty J, Burchell A, Wilson SM. Glucocorticoids can activate the α-ENaC gene promoter independently of SGK1. Biochem J. 2009;423:189–197. doi: 10.1042/BJ20090366. [DOI] [PMC free article] [PubMed] [Google Scholar]
- Murray JT, Campbell DG, Morrice N, Auld GC, Shpiro N, Marquez R, et al. Exploitation of KESTREL to identify NDRG family members as physiological substrates for SGK1 and GSK3. Biochem J. 2004;384:477–488. doi: 10.1042/BJ20041057. [DOI] [PMC free article] [PubMed] [Google Scholar]
- Murray JT, Cummings LA, Bloomberg GB, Cohen P. Identification of different specificity requirements between SGK1 and PKB alpha. FEBS Lett. 2005;579:991–994. doi: 10.1016/j.febslet.2004.12.069. [DOI] [PubMed] [Google Scholar]
- Myerburg MM, Butterworth MB, McKenna EE, Peters KW, Frizzell RA, Kleyman TR, et al. Airway surface liquid volume regulates ENaC by altering the serine protease-protease inhibitor balance – a mechanism for sodium hyperabsorption in cystic fibrosis. J Biol Chem. 2006;281:27942–27949. doi: 10.1074/jbc.M606449200. [DOI] [PubMed] [Google Scholar]
- Myerburg MM, Harvey PR, Heidrich EM, Pilewski JM, Butterworth MB. Acute regulation of the epithelial sodium channel in airway epithelia by proteases and trafficking. Am J Respir Cell Mol Biol. 2010;43:712–719. doi: 10.1165/rcmb.2009-0348OC. [DOI] [PMC free article] [PubMed] [Google Scholar]
- Olver RE, Walters DV, Wilson SM. Developmental regulation of lung liquid transport. Annu Rev Physiol. 2004;66:77–101. doi: 10.1146/annurev.physiol.66.071702.145229. [DOI] [PubMed] [Google Scholar]
- Park J, Leong MLL, Buse P, Maiyar AC, Firestone GL, Hemmings BA. Serum and glucocorticoid-inducible kinase (SGK) is a target of the PI 3-kinase-stimulated signaling pathway. EMBO J. 1999;18:3024–3033. doi: 10.1093/emboj/18.11.3024. [DOI] [PMC free article] [PubMed] [Google Scholar]
- Passero CJ, Mueller GM, Rondon-Berrios H, Tofovic SP, Hughey RP, Kleyman TR. Plasmin activates epithelial Na+ channels by cleaving the gamma subunit. J Biol Chem. 2008;283:36586–36591. doi: 10.1074/jbc.M805676200. [DOI] [PMC free article] [PubMed] [Google Scholar]
- Păunescu TG, Blazer-Yost BL, Vlahos CJ, Helman SI. LY-294002-inhibitable PI 3-kinase and regulation of baseline rates of Na+ transport in A6 epithelia. Am J Physiol Cell Physiol. 2000;279:C236–C247. doi: 10.1152/ajpcell.2000.279.1.C236. [DOI] [PubMed] [Google Scholar]
- Pochynyuk O, Bugaj V, Stockand JD. Physiologic regulation of the epithelial sodium channel by phosphatidylinositides. Curr Opin Nephrol Hypertens. 2008;17:533–540. doi: 10.1097/MNH.0b013e328308fff3. [DOI] [PMC free article] [PubMed] [Google Scholar]
- Proud CG. Signalling to translation: how signal transduction pathways control the protein synthetic machinery. Biochem J. 2007;403:217–234. doi: 10.1042/BJ20070024. [DOI] [PubMed] [Google Scholar]
- Ramminger SJ, Richard K, Inglis SK, Land SC, Olver RE, Wilson SM. A regulated apical Na+ conductance in dexamethasone-treated H441 airway epithelial cells. Am J Physiol Lung Cell Mol Physiol. 2004;287:L411–L419. doi: 10.1152/ajplung.00407.2003. [DOI] [PubMed] [Google Scholar]
- Raynaud FI, Eccles S, Clarke PA, Hayes A, Nutley B, Alix S, et al. Pharmacologic characterization of a potent inhibitor of class I phosphatidylinositide 3-kinases. Cancer Res. 2007;67:5840–5850. doi: 10.1158/0008-5472.CAN-06-4615. [DOI] [PubMed] [Google Scholar]
- Record RD, Froelich LL, Vlahos CJ, Blazer-Yost BL. Phosphatidylinositol 3-kinase activation is required for insulin-stimulated sodium transport in A6 cells. Am J Physiol Endocrinol Metab. 1998;274:C531–C536. doi: 10.1152/ajpendo.1998.274.4.E611. [DOI] [PubMed] [Google Scholar]
- Reisenauer MR, Anderson M, Huang L, Zhang ZJ, Zhou QL, Kone BC, et al. AF17 competes with AF9 for binding to Dot1a to up-regulate transcription of epithelial Na+ channel alpha. J Biol Chem. 2009;284:35659–35669. doi: 10.1074/jbc.M109.038448. [DOI] [PMC free article] [PubMed] [Google Scholar]
- Rexhepaj R, Artunc F, Grahammer F, Nasir O, Sandu C, Friedrich B, et al. SGK1 is not required for regulation of colonic ENaC activity. Pflugers Arch. 2006;453:97–105. doi: 10.1007/s00424-006-0111-4. [DOI] [PubMed] [Google Scholar]
- Rossier BC, Stutts MJ. Activation of the epithelial sodium channel (ENaC) by serine proteases. Annu Rev Physiol. 2009;71:361–379. doi: 10.1146/annurev.physiol.010908.163108. [DOI] [PubMed] [Google Scholar]
- Sarbassov DD, Guertin DA, Ali SM, Sabatini DM. Phosphorylation and regulation of Akt/PKB by the rictor-mTOR complex. Science. 2005;307:1098–1101. doi: 10.1126/science.1106148. [DOI] [PubMed] [Google Scholar]
- Sherk AB, Frigo DE, Schnackenberg CG, Bray JD, Laping NJ, Trizna W, et al. Development of a small-molecule serum- and glucocorticoid-regulated kinase-1 antagonist and its evaluation as a prostate cancer therapeutic. Cancer Res. 2008;68:7475–7483. doi: 10.1158/0008-5472.CAN-08-1047. [DOI] [PMC free article] [PubMed] [Google Scholar]
- Tan CD, Selvanathar IA, Baines DL. Cleavage of endogenous gamma ENaC and elevated abundance of alpha ENaC are associated with increased Na+ transport in response to apical fluid volume expansion in human H441 airway epithelial cells. Pflugers Arch. 2011;462:431–441. doi: 10.1007/s00424-011-0982-x. [DOI] [PMC free article] [PubMed] [Google Scholar]
- Thomas CP, Itani OA. New insights into epithelial sodium channel function in the kidney: site of action, regulation by ubiquitin ligases, serum- and glucocorticoid-inducible kinase and proteolysis. Curr Opin Nephrol Hypertens. 2004;13:541–548. doi: 10.1097/00041552-200409000-00010. [DOI] [PubMed] [Google Scholar]
- Thomas CP, Campbell JR, Wright PJ, Husted RF. cAMP-stimulated Na+ transport in H441 distal lung epithelial cells: role of PKA, phosphatidylinositol 3-kinase, and sgk1. Am J Physiol Lung Cell Mol Physiol. 2004;287:L843–L851. doi: 10.1152/ajplung.00340.2003. [DOI] [PubMed] [Google Scholar]
- Thoreen CC, Kang SA, Chang JW, Liu Q, Zhang J, Gao Y, et al. An ATP-competitive mammalian target of rapamycin inhibitor reveals rapamycin-resistant functions of mTORC1. J Biol Chem. 2009;284:8023–8032. doi: 10.1074/jbc.M900301200. [DOI] [PMC free article] [PubMed] [Google Scholar]
- Vallet V, Chraibi A, Gaeggeler HP, Horisberger JD, Rossier BC. An epithelial serine protease activates the amiloride-sensitive sodium channel. Nature. 1997;389:607–610. doi: 10.1038/39329. [DOI] [PubMed] [Google Scholar]
- Vuagniaux G, Vallet V, Jaeger NF, Hummler E, Rossier BC. Synergistic activation of ENaC by three membrane-bound channel-activating serine proteases (mCAP1, mCAP2, and mCAP3) and serum- and glucocorticoid-regulated kinase (Sgk1) in Xenopus oocytes. J Gen Physiol. 2002;120:191–201. doi: 10.1085/jgp.20028598. [DOI] [PMC free article] [PubMed] [Google Scholar]
- Wang J, Barbry P, Maiyar AC, Rozansky DJ, Bhargava A, Leong M, et al. SGK integrates insulin and mineralocorticoid regulation of epithelial sodium transport. Am J Physiol Renal Physiol. 2001;280:F303–F313. doi: 10.1152/ajprenal.2001.280.2.F303. [DOI] [PubMed] [Google Scholar]
- Wulff P, Vallon V, Huang DY, Völkl H, Yu F, Richter K, et al. Impaired renal Na+ retention in the sgkl-knockout mouse. J Clin Invest. 2002;110:1263–1268. doi: 10.1172/JCI15696. [DOI] [PMC free article] [PubMed] [Google Scholar]
- Zhang WZ, Xia XF, Reisenauer MR, Rieg T, Lang F, Kuhl D, et al. Aldosterone-induced Sgk1 relieves Dot1a-Af9-mediated transcriptional repression of epithelial Na+ channel alpha. J Clin Invest. 2007;117:773–783. doi: 10.1172/JCI29850. [DOI] [PMC free article] [PubMed] [Google Scholar]