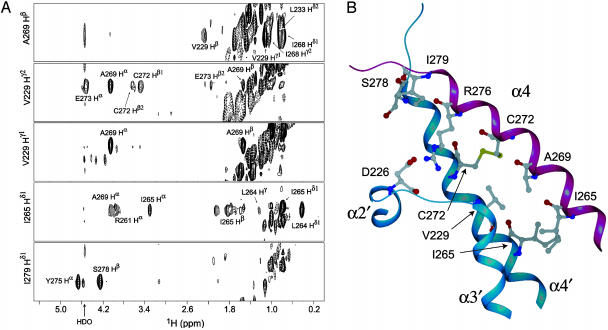
Fig. 2.
(A) Selected 13C–1H strips from the 13C-edited/12C-filtered 3D NOESY spectrum (21) identifying NOEs at the dimer interface of ThKaiA180C. The spectrum was acquired in a heterodimeric sample of unenriched and 13C/15N-enriched protein. (B) The dimer interface of ThKaiA180C. Shown here is α4 of one subunit in magenta, and in blue the C-terminal region of α2′, the loop between α2′ and α3′, and the N-terminal region of α3′ and α4′ are shown. Residues identified as being part of the dimer interface by the 13C-edited/12C-filtered 3D NOESY and the intersubunit disulfide bond and salt-bridge are also shown.

