
Figure 6.
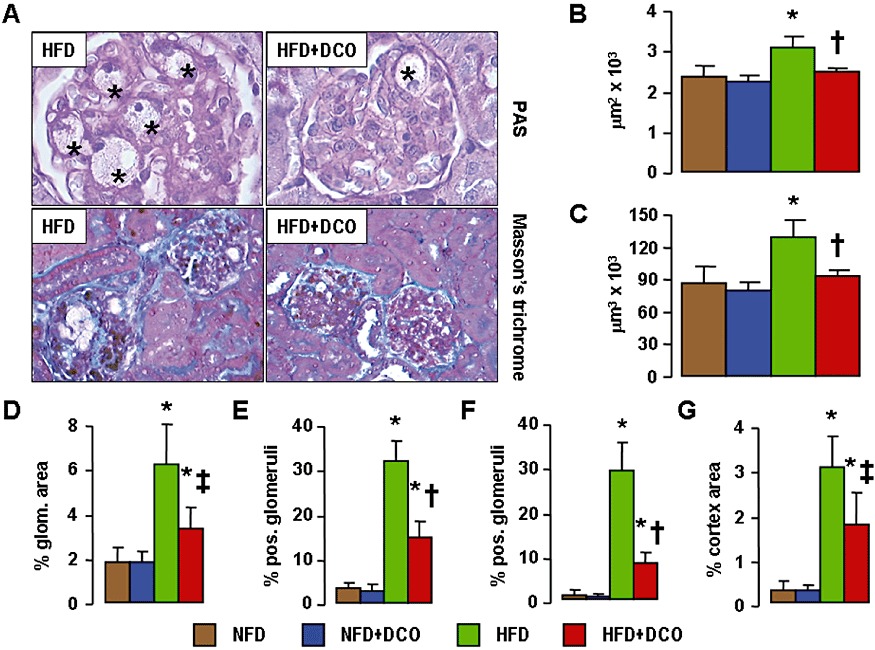
Kidney lesions. PAS and Masson's trichrome staining of kidneys from representative untreated and D-carnosine octylester-treated ApoE null mice fed a HFD (panel A; *= microaneurysms containing foam cells); and quantification of mGA (panel B), mGV (panel C), glomerular matrix (panel D), foam cells (panel E), microaneurysms (panel F) and tubulo-interstitial fibrosis (panel G) in untreated and D-carnosine octylester-treated ApoE null mice fed a NFD or a HFD (mean ± SD; n= 10 per group); scale bar = 50 µm. *P < 0.001 versus NFD-fed mice; †P < 0.001 versus untreated mice. DCO = D-carnosine octylester.