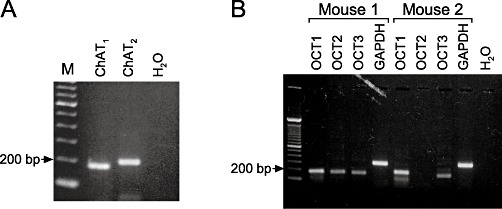
Figure 1.

RT-PCR of components of the nnCS in mouse tracheal epithelial cells. (A) RT-PCR of ChAT in mouse tracheal epithelial cells. RT-PCR experiments showed a prominent ChAT band at about 200 bp with two different primers (ChAT1, ChAT2). H2O control is without template (M: size marker). (B) RT-PCR of OCT in mouse tracheal epithelium. Depicted are RT-PCR results of OCT1-3 from two of three mice. A RT-PCR product for OCT1 and OCT3 was visible at a size of about 200 bp in all tissue samples. For OCT2 the band at 200 bp only occurred in two out of three tissue samples. GAPDH and H2O denote the controls (M: size marker).
