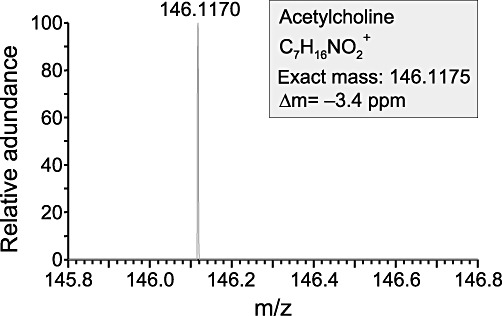
Figure 2.

Positive DESI mass spectrum of the luminal surface of the mouse trachea. The y axis of the spectrum shows the relative abundance, after automatic scaling of the intensity of the highest signal in the depicted mass range to 100%. ACh was identified in the signal at m/z 146.1170. Since ACh was the only signal detected in the depicted mass range, it was automatically scaled to 100%. The label Δm =−3.4 expresses the exactness of the measured mass of ACh compared with the theoretically calculated mass of ACh.
