
Figure 3.
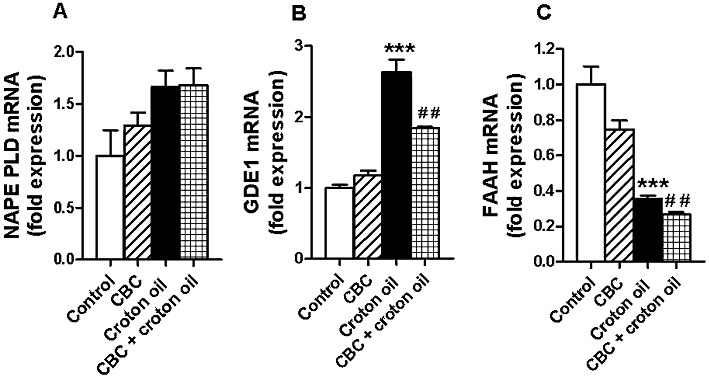
Relative expression of NAPE PLD (A), GDE1 (B) and FAAH (C) mRNA in the jejunum of animals treated or not with croton oil. Some mice treated with croton oil were also treated with CBC (15 mg·kg−1, i.p.). Total RNA extracted from the intestine of control and croton-oil-treated mice was subjected to quantitative (real-time) RT-PCR analysis as described in Methods. Data were analysed by GENEX software for groupwise comparisons and statistical analysis. The expression in control tissues for each target was considered as 1. Results are means ± SEM of four experiments. ***P < 0.001 versus control and ##P < 0.01 versus croton oil.